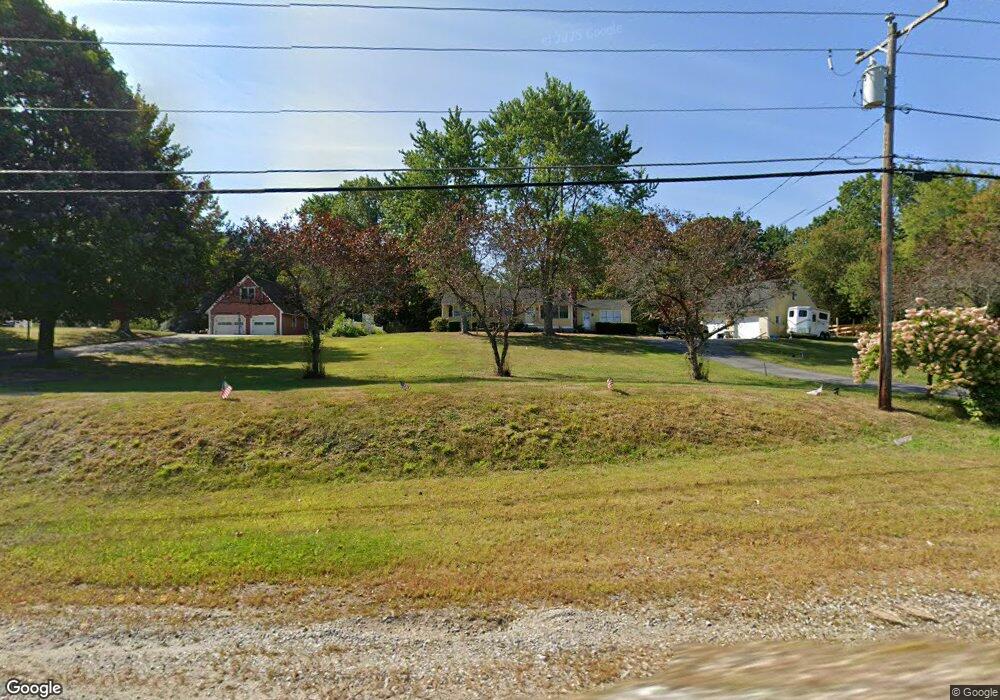
105 Broad St Hollis, NH 03049
Hollis NeighborhoodEstimated Value: $585,000 - $622,000
3
Beds
1
Bath
1,948
Sq Ft
$307/Sq Ft
Est. Value
About This Home
This home is located at 105 Broad St, Hollis, NH 03049 and is currently estimated at $597,879, approximately $306 per square foot. 105 Broad St is a home located in Hillsborough County with nearby schools including Hollis Primary School, Hollis Upper Elementary School, and Hollis-Brookline Middle School.
Ownership History
Date
Name
Owned For
Owner Type
Purchase Details
Closed on
Oct 30, 2020
Sold by
Penniman Deborah A and Penniman William M
Bought by
Mclinn Michael J and Mclinn Jillian
Current Estimated Value
Purchase Details
Closed on
Aug 7, 2020
Sold by
Penniman Eric W and Schoorens Sarah
Bought by
Penniman Deborah A and Penniman William M
Home Financials for this Owner
Home Financials are based on the most recent Mortgage that was taken out on this home.
Original Mortgage
$359,100
Interest Rate
3.1%
Mortgage Type
New Conventional
Purchase Details
Closed on
May 27, 2014
Sold by
Penniman Ft
Bought by
Penniman Eric W and Schoorens Sarah
Create a Home Valuation Report for This Property
The Home Valuation Report is an in-depth analysis detailing your home's value as well as a comparison with similar homes in the area
Home Values in the Area
Average Home Value in this Area
Purchase History
| Date | Buyer | Sale Price | Title Company |
|---|---|---|---|
| Mclinn Michael J | $378,000 | None Available | |
| Mclinn Michael J | $378,000 | None Available | |
| Penniman Deborah A | $378,000 | None Available | |
| Penniman Deborah A | $378,000 | None Available | |
| Penniman Eric W | $293,000 | -- | |
| Penniman Eric W | $293,000 | -- |
Source: Public Records
Mortgage History
| Date | Status | Borrower | Loan Amount |
|---|---|---|---|
| Previous Owner | Penniman Deborah A | $359,100 | |
| Previous Owner | Penniman Eric W | $150,000 | |
| Previous Owner | Penniman Eric W | $75,000 | |
| Previous Owner | Penniman Eric W | $20,000 |
Source: Public Records
Tax History Compared to Growth
Tax History
| Year | Tax Paid | Tax Assessment Tax Assessment Total Assessment is a certain percentage of the fair market value that is determined by local assessors to be the total taxable value of land and additions on the property. | Land | Improvement |
|---|---|---|---|---|
| 2024 | $8,631 | $486,800 | $241,800 | $245,000 |
| 2023 | $8,067 | $484,200 | $241,800 | $242,400 |
| 2022 | $11,050 | $489,600 | $241,800 | $247,800 |
| 2021 | $6,817 | $300,300 | $154,600 | $145,700 |
| 2020 | $6,961 | $300,300 | $154,600 | $145,700 |
| 2019 | $6,937 | $300,300 | $154,600 | $145,700 |
| 2018 | $6,508 | $300,300 | $154,600 | $145,700 |
| 2017 | $5,167 | $223,200 | $117,200 | $106,000 |
| 2016 | $5,230 | $223,200 | $117,200 | $106,000 |
| 2015 | $5,138 | $223,200 | $117,200 | $106,000 |
| 2014 | $5,163 | $223,200 | $117,200 | $106,000 |
| 2013 | $5,093 | $223,200 | $117,200 | $106,000 |
Source: Public Records
Map
Nearby Homes