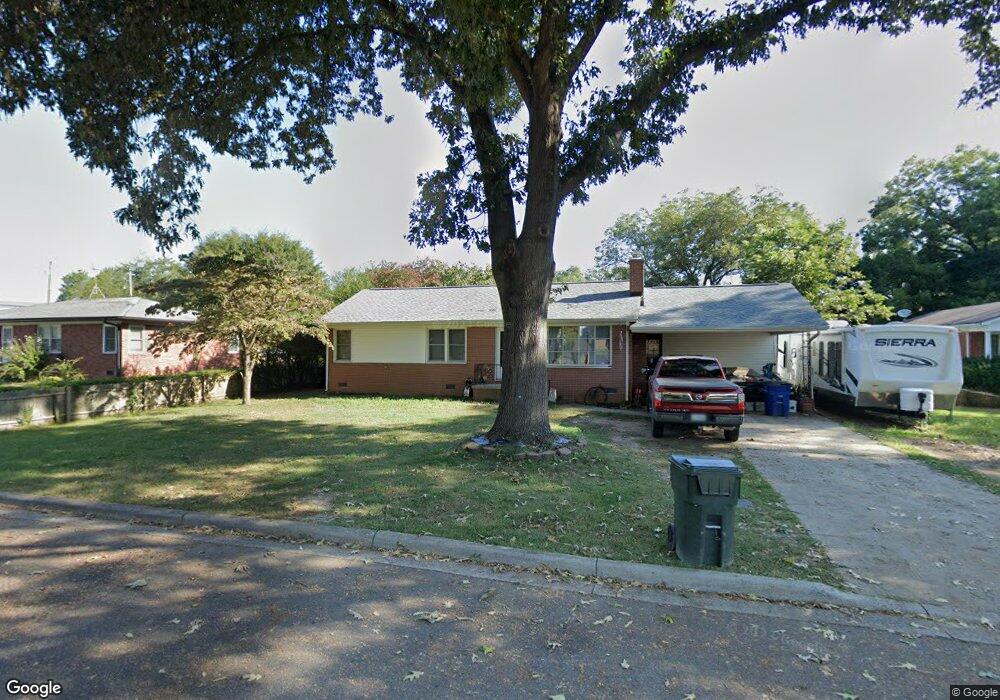
105 Carolina Cir Lincolnton, NC 28092
Estimated Value: $215,000 - $242,000
3
Beds
2
Baths
1,205
Sq Ft
$185/Sq Ft
Est. Value
About This Home
This home is located at 105 Carolina Cir, Lincolnton, NC 28092 and is currently estimated at $223,151, approximately $185 per square foot. 105 Carolina Cir is a home located in Lincoln County with nearby schools including S. Ray Lowder Elementary School, Lincolnton Middle School, and Lincolnton High School.
Ownership History
Date
Name
Owned For
Owner Type
Purchase Details
Closed on
Jun 6, 2017
Sold by
Ist Holdings Llc
Bought by
Beam Michael B and Beam Crystal L
Current Estimated Value
Home Financials for this Owner
Home Financials are based on the most recent Mortgage that was taken out on this home.
Original Mortgage
$110,000
Outstanding Balance
$91,522
Interest Rate
4.03%
Mortgage Type
New Conventional
Estimated Equity
$131,629
Purchase Details
Closed on
May 22, 2015
Sold by
Jones Alvin W and Jones Mable M
Bought by
The Alvin W Jones & Mable A Jones Living and Jones Mable A
Purchase Details
Closed on
Sep 5, 2014
Sold by
Jones Alvin M and Jones Mabel M
Bought by
Ist Holdings Llc
Home Financials for this Owner
Home Financials are based on the most recent Mortgage that was taken out on this home.
Original Mortgage
$76,500
Interest Rate
4.2%
Mortgage Type
Commercial
Create a Home Valuation Report for This Property
The Home Valuation Report is an in-depth analysis detailing your home's value as well as a comparison with similar homes in the area
Home Values in the Area
Average Home Value in this Area
Purchase History
| Date | Buyer | Sale Price | Title Company |
|---|---|---|---|
| Beam Michael B | $120,000 | None Available | |
| The Alvin W Jones & Mable A Jones Living | -- | None Available | |
| Ist Holdings Llc | $90,000 | None Available |
Source: Public Records
Mortgage History
| Date | Status | Borrower | Loan Amount |
|---|---|---|---|
| Open | Beam Michael B | $110,000 | |
| Previous Owner | Ist Holdings Llc | $76,500 |
Source: Public Records
Tax History Compared to Growth
Tax History
| Year | Tax Paid | Tax Assessment Tax Assessment Total Assessment is a certain percentage of the fair market value that is determined by local assessors to be the total taxable value of land and additions on the property. | Land | Improvement |
|---|---|---|---|---|
| 2025 | $1,606 | $146,781 | $22,000 | $124,781 |
| 2024 | $1,586 | $146,781 | $22,000 | $124,781 |
| 2023 | $1,581 | $146,781 | $22,000 | $124,781 |
| 2022 | $1,240 | $95,421 | $17,000 | $78,421 |
| 2021 | $1,240 | $95,421 | $17,000 | $78,421 |
| 2020 | $1,106 | $95,421 | $17,000 | $78,421 |
| 2019 | $1,106 | $95,421 | $17,000 | $78,421 |
| 2018 | $1,144 | $89,028 | $15,000 | $74,028 |
| 2017 | $1,043 | $89,028 | $15,000 | $74,028 |
| 2016 | $1,043 | $89,028 | $15,000 | $74,028 |
| 2015 | $1,108 | $89,028 | $15,000 | $74,028 |
| 2014 | $1,173 | $94,152 | $16,000 | $78,152 |
Source: Public Records
Map
Nearby Homes
- 818 Grier St
- 916 E Park Dr
- 681 S Grove St
- 689 S Grove St
- 697 S Grove St
- 68 Mockingbird Ln
- 00 Glenn St
- 792 Carolina Mill Cir
- 515 S Academy St
- 515 Willow St
- 110 Robin Rd
- 00 Lake Sylvia Rd
- 140 Robin Rd
- 317 S High St
- 627 W Main St
- 329 E Congress St
- 1218 W Highview Ln
- 668 Riverside Dr
- 217 Rock Creek Dr
- 411 W Sycamore St
- 103 Carolina Cir
- 107 Carolina Cir
- 101 Carolina Cir
- 101 Carolina Cir Unit 13
- 104 Carolina Cir
- 102 Carolina Cir
- 115 Massapoag Rd
- 106 Carolina Cir
- 125 Massapoag Rd
- 100 Carolina Cir
- 121 Massapoag Rd
- 1104 S Aspen St
- 205 Crescent Ct
- 1114 S Aspen St
- 203 Crescent Ct
- 201 Crescent Ct
- 1134 Laboratory Rd
- 209 Crescent Ct
- 140 Massapoag Rd
- 144 Massapoag Rd