L
Seller's Agent in 2020
Lisa Davis
Century 21 Smith Branch & Pope
Estimated Value: $243,000 - $336,000
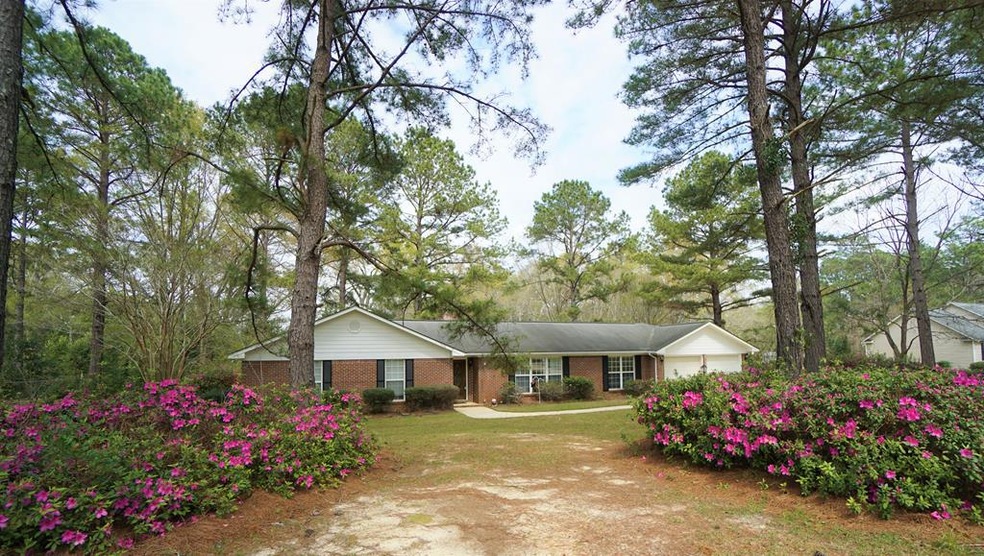
ROOM TO GROW- This brick beauty is sure to impress with its unique floor plan! It has two master bedrooms: one with private entrance the other with access to the cozy back porch area, walk in closets & their own private baths, as well as two additional bedrooms and a full bath. This home also features a spacious family room with gas fireplace, built-ins and vaulted ceiling, a formal living room and dining room with trey ceiling, large eat-in kitchen with tons of cabinets and counter space. If entertaining is your thing, your guests are sure to love the screened porch, open patio area and large fenced back yard. Call today for your own private showing!
Last Agent to Sell the Property
Lisa Davis
Century 21 Smith Branch & Pope Brokerage Phone: 2293868737 Listed on: 05/03/2020
Last Buyer's Agent
Christina Hawkins
Shiver And Williams Realty, LLC
| Date | Buyer | Sale Price | Title Company |
|---|---|---|---|
| Janes Joshusa P | $167,000 | -- | |
| Sanchez Adina | -- | -- | |
| Sanchez Adina | $140,900 | -- |
| Date | Status | Borrower | Loan Amount |
|---|---|---|---|
| Open | Janes Joshusa P | $168,686 | |
| Previous Owner | Sanchez Adina | $141,226 |
| Date | Event | Price | List to Sale | Price per Sq Ft |
|---|---|---|---|---|
| 08/14/2020 08/14/20 | Sold | $167,000 | -- | $77 / Sq Ft |
| 05/03/2020 05/03/20 | Pending | -- | -- | -- |
| Year | Tax Paid | Tax Assessment Tax Assessment Total Assessment is a certain percentage of the fair market value that is determined by local assessors to be the total taxable value of land and additions on the property. | Land | Improvement |
|---|---|---|---|---|
| 2024 | $2,366 | $64,031 | $8,000 | $56,031 |
| 2023 | $2,366 | $64,031 | $8,000 | $56,031 |
| 2022 | $2,303 | $64,031 | $8,000 | $56,031 |
| 2021 | $2,299 | $64,031 | $8,000 | $56,031 |
| 2020 | $2,303 | $64,031 | $8,000 | $56,031 |
| 2019 | $2,299 | $64,031 | $8,000 | $56,031 |
| 2018 | $2,171 | $64,031 | $8,000 | $56,031 |
| 2017 | $2,171 | $64,031 | $8,000 | $56,031 |
| 2016 | $2,299 | $64,031 | $8,000 | $56,031 |
| 2015 | $2,174 | $64,031 | $8,000 | $56,031 |
| 2014 | $2,174 | $64,031 | $8,000 | $56,031 |
| 2013 | -- | $56,360 | $7,042 | $49,318 |
| 2012 | -- | $64,031 | $8,000 | $56,031 |
L
Seller's Agent in 2020
Lisa Davis
Century 21 Smith Branch & Pope
C
Buyer's Agent in 2020
Christina Hawkins
Shiver And Williams Realty, LLC
Source: Albany Board of REALTORS®
MLS Number: 144739
APN: SV18A-013-000