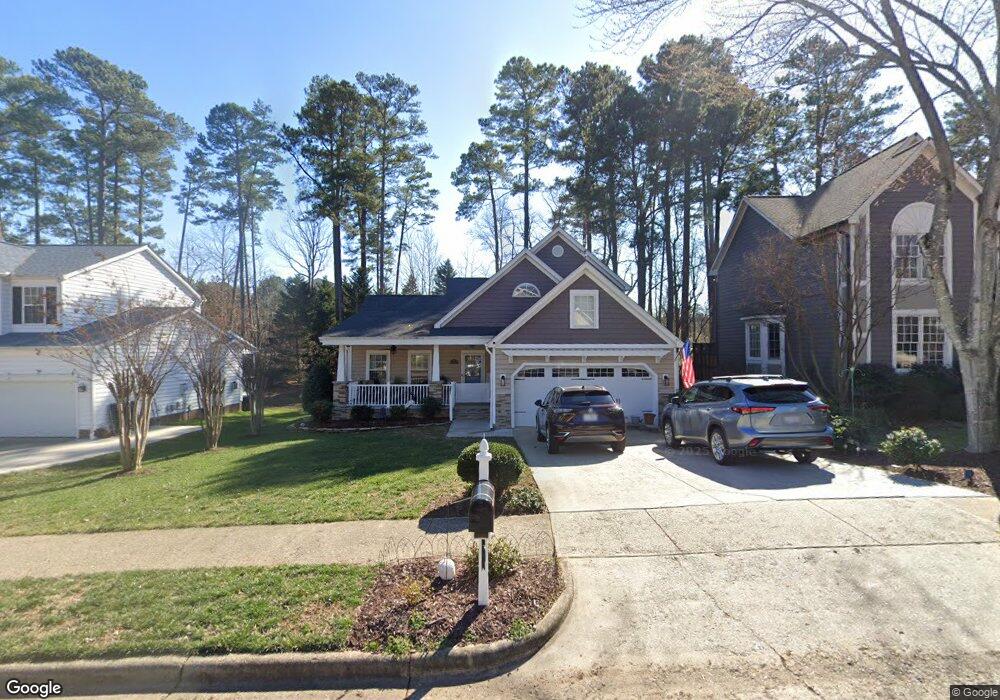
105 Cedarpost Dr Cary, NC 27513
West Cary NeighborhoodEstimated Value: $628,398 - $656,000
3
Beds
3
Baths
2,002
Sq Ft
$321/Sq Ft
Est. Value
About This Home
This home is located at 105 Cedarpost Dr, Cary, NC 27513 and is currently estimated at $642,600, approximately $320 per square foot. 105 Cedarpost Dr is a home located in Wake County with nearby schools including Weatherstone Elementary School, Davis Drive Middle, and Green Hope High.
Ownership History
Date
Name
Owned For
Owner Type
Purchase Details
Closed on
Sep 30, 2014
Sold by
Bowen Scott L and Bowen Dena H
Bought by
Frederick Karl P and Frederick Debra
Current Estimated Value
Home Financials for this Owner
Home Financials are based on the most recent Mortgage that was taken out on this home.
Original Mortgage
$248,000
Outstanding Balance
$183,420
Interest Rate
3.25%
Mortgage Type
Adjustable Rate Mortgage/ARM
Estimated Equity
$459,180
Purchase Details
Closed on
Nov 15, 2000
Sold by
Malonson Kenneth T
Bought by
Bowen Scott L and Bowen Dena H
Home Financials for this Owner
Home Financials are based on the most recent Mortgage that was taken out on this home.
Original Mortgage
$158,300
Interest Rate
7.83%
Purchase Details
Closed on
Mar 5, 1999
Sold by
M I Schottenstein Homes Inc
Bought by
Malonson Kenneth T and Malonson Nancy A
Home Financials for this Owner
Home Financials are based on the most recent Mortgage that was taken out on this home.
Original Mortgage
$126,700
Interest Rate
6.79%
Create a Home Valuation Report for This Property
The Home Valuation Report is an in-depth analysis detailing your home's value as well as a comparison with similar homes in the area
Home Values in the Area
Average Home Value in this Area
Purchase History
| Date | Buyer | Sale Price | Title Company |
|---|---|---|---|
| Frederick Karl P | $310,000 | None Available | |
| Bowen Scott L | $198,000 | -- | |
| Malonson Kenneth T | $187,500 | -- |
Source: Public Records
Mortgage History
| Date | Status | Borrower | Loan Amount |
|---|---|---|---|
| Open | Frederick Karl P | $248,000 | |
| Previous Owner | Bowen Scott L | $158,300 | |
| Previous Owner | Malonson Kenneth T | $126,700 |
Source: Public Records
Tax History Compared to Growth
Tax History
| Year | Tax Paid | Tax Assessment Tax Assessment Total Assessment is a certain percentage of the fair market value that is determined by local assessors to be the total taxable value of land and additions on the property. | Land | Improvement |
|---|---|---|---|---|
| 2025 | $5,236 | $608,613 | $240,000 | $368,613 |
| 2024 | $5,123 | $608,613 | $240,000 | $368,613 |
| 2023 | $3,780 | $375,271 | $117,000 | $258,271 |
| 2022 | $3,639 | $375,271 | $117,000 | $258,271 |
| 2021 | $3,506 | $368,914 | $117,000 | $251,914 |
| 2020 | $3,525 | $368,914 | $117,000 | $251,914 |
| 2019 | $3,413 | $316,935 | $102,000 | $214,935 |
| 2018 | $3,203 | $316,935 | $102,000 | $214,935 |
| 2017 | $3,078 | $316,935 | $102,000 | $214,935 |
| 2016 | $3,032 | $316,935 | $102,000 | $214,935 |
| 2015 | $2,900 | $292,560 | $86,000 | $206,560 |
| 2014 | -- | $292,560 | $86,000 | $206,560 |
Source: Public Records
Map
Nearby Homes
- 120 Harmony Hill Ln
- 101 Breckenwood Dr
- 104 Bradwyck Dr
- 206 Swiss Lake Dr
- 128 Wheatsbury Dr
- 205 Swiss Lake Dr
- 316 Arlington Ridge
- 104 Foxcrest Ct
- 105 Trailview Dr
- 102 Trailview Dr
- 111 N Coslett Ct
- 104 Pellinore Ct
- 105 Swordgate Dr
- 124 Covington Square Dr
- 116 Modena Dr
- 111 Gingergate Dr
- 105 Croatan Cir
- 722 Mcrae Rd
- 210 Gingergate Dr
- 467 Methven Grove Dr
- 103 Cedarpost Dr
- 107 Cedarpost Dr
- 109 Cedarpost Dr
- 101 Cedarpost Dr
- 111 Cedarpost Dr
- 106 Cedarpost Dr
- 104 Cedarpost Dr
- 108 Cedarpost Dr
- 100 Cedarpost Dr
- 113 Cedarpost Dr
- 110 Cedarpost Dr
- 102 Corral Ct
- 201 Cedarpost Dr
- 223 Stablegate Dr
- 104 Corral Ct
- 200 Cedarpost Dr
- 225 Stablegate Dr
- 100 Fairfax Ln
- 100 Corral Ct
- 203 Cedarpost Dr