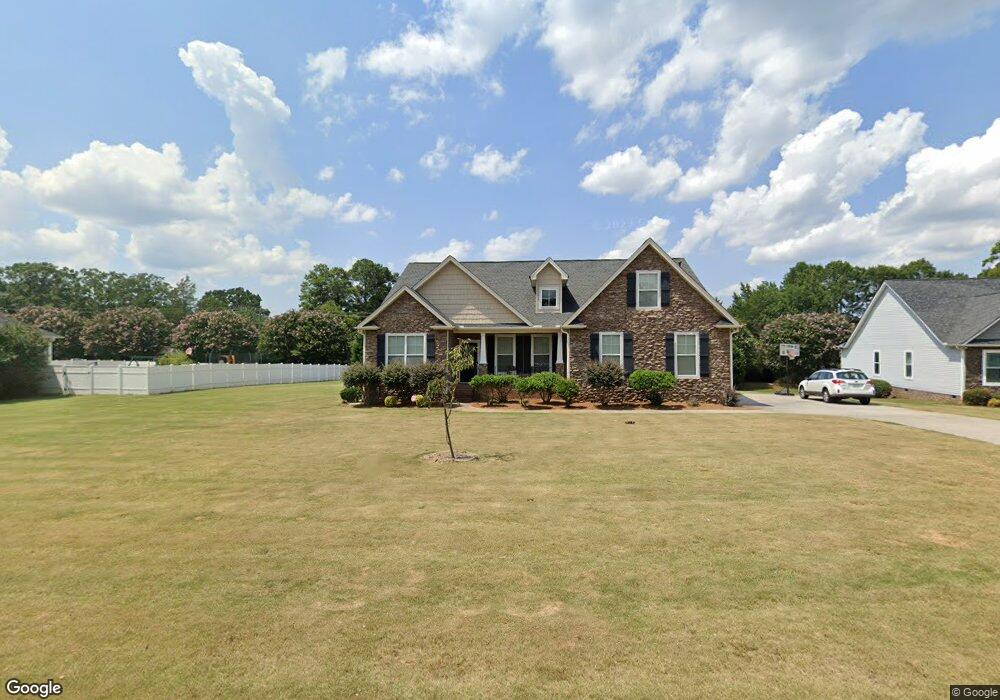
105 Chad Ct Anderson, SC 29621
Estimated Value: $394,009 - $486,000
3
Beds
2
Baths
2,442
Sq Ft
$179/Sq Ft
Est. Value
About This Home
This home is located at 105 Chad Ct, Anderson, SC 29621 and is currently estimated at $438,002, approximately $179 per square foot. 105 Chad Ct is a home located in Anderson County with nearby schools including North Pointe Elementary School, McCants Middle School, and T.L. Hanna High School.
Ownership History
Date
Name
Owned For
Owner Type
Purchase Details
Closed on
Aug 24, 2012
Sold by
Unique Logic Llc
Bought by
Junkins Russell S and Junkins Blaire B
Current Estimated Value
Home Financials for this Owner
Home Financials are based on the most recent Mortgage that was taken out on this home.
Original Mortgage
$178,500
Outstanding Balance
$123,132
Interest Rate
3.58%
Mortgage Type
New Conventional
Estimated Equity
$314,870
Purchase Details
Closed on
Jan 21, 2011
Sold by
Galaxy Homes Llc
Bought by
Unique Logic Llc
Purchase Details
Closed on
Jan 21, 2010
Sold by
Grandsouth Bank
Bought by
Galaxy Homes Llc
Home Financials for this Owner
Home Financials are based on the most recent Mortgage that was taken out on this home.
Original Mortgage
$329,050
Interest Rate
4.94%
Mortgage Type
Seller Take Back
Purchase Details
Closed on
Nov 13, 2009
Sold by
Tower Homes Inc and Seppala Nathan P
Bought by
Grandsouth Bank
Create a Home Valuation Report for This Property
The Home Valuation Report is an in-depth analysis detailing your home's value as well as a comparison with similar homes in the area
Home Values in the Area
Average Home Value in this Area
Purchase History
| Date | Buyer | Sale Price | Title Company |
|---|---|---|---|
| Junkins Russell S | $210,000 | -- | |
| Unique Logic Llc | $337,500 | -- | |
| Galaxy Homes Llc | $325,000 | -- | |
| Grandsouth Bank | $25,000 | -- |
Source: Public Records
Mortgage History
| Date | Status | Borrower | Loan Amount |
|---|---|---|---|
| Open | Junkins Russell S | $178,500 | |
| Previous Owner | Galaxy Homes Llc | $329,050 |
Source: Public Records
Tax History Compared to Growth
Tax History
| Year | Tax Paid | Tax Assessment Tax Assessment Total Assessment is a certain percentage of the fair market value that is determined by local assessors to be the total taxable value of land and additions on the property. | Land | Improvement |
|---|---|---|---|---|
| 2024 | $1,225 | $10,300 | $1,380 | $8,920 |
| 2023 | $1,233 | $10,300 | $1,380 | $8,920 |
| 2022 | $1,202 | $10,300 | $1,380 | $8,920 |
| 2021 | $1,073 | $8,790 | $1,080 | $7,710 |
| 2020 | $1,063 | $8,790 | $1,080 | $7,710 |
| 2019 | $1,063 | $8,790 | $1,080 | $7,710 |
| 2018 | $1,082 | $8,790 | $1,080 | $7,710 |
| 2017 | -- | $8,790 | $1,080 | $7,710 |
| 2016 | $1,033 | $8,350 | $1,120 | $7,230 |
| 2015 | $1,056 | $8,350 | $1,120 | $7,230 |
| 2014 | $1,052 | $8,350 | $1,120 | $7,230 |
Source: Public Records
Map
Nearby Homes
- 127 Cathey Rd
- 282 Silo Ridge Dr
- Lakehurst Plan at Silo Ridge
- Litchfield Plan at Silo Ridge
- Lochlan Plan at Silo Ridge
- 276 Silo Ridge Dr
- 286 Silo Ridge Dr
- 267 Silo Ridge Dr
- 231 Silo Ridge Dr
- 278 Silo Ridge Dr
- 284 Silo Ridge Dr
- 129 Silo Ridge Dr
- 288 Silo Ridge Dr
- 131 Silo Ridge Dr
- 274 Silo Ridge Dr
- 285 Silo Ridge Dr