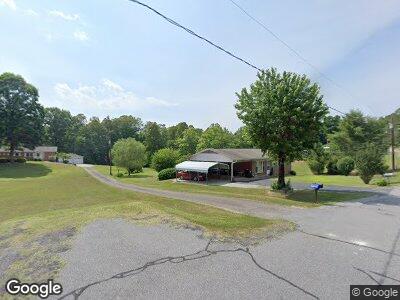
105 Clontz Dr Morganton, NC 28655
Estimated Value: $211,000 - $239,000
3
Beds
1
Bath
1,176
Sq Ft
$190/Sq Ft
Est. Value
About This Home
This home is located at 105 Clontz Dr, Morganton, NC 28655 and is currently estimated at $223,492, approximately $190 per square foot. 105 Clontz Dr is a home located in Burke County with nearby schools including Glen Alpine Elementary School, Table Rock Middle School, and Freedom High School.
Ownership History
Date
Name
Owned For
Owner Type
Purchase Details
Closed on
May 11, 2021
Sold by
Whitworth Ernie Scott and Whitworth Melanie L
Bought by
Webb David Alan
Current Estimated Value
Purchase Details
Closed on
Aug 8, 2012
Sold by
Silver Creek Community Property Owners A
Bought by
Webb Jerriann
Purchase Details
Closed on
Nov 12, 2005
Sold by
Benfield Robert W and Benfield Kay M
Bought by
Webb David Alan
Home Financials for this Owner
Home Financials are based on the most recent Mortgage that was taken out on this home.
Original Mortgage
$95,300
Interest Rate
4.75%
Mortgage Type
Adjustable Rate Mortgage/ARM
Purchase Details
Closed on
Apr 20, 2005
Sold by
Saulman Ralph Lee and Saulman Marilyn Silve
Bought by
Benfield Robert W
Create a Home Valuation Report for This Property
The Home Valuation Report is an in-depth analysis detailing your home's value as well as a comparison with similar homes in the area
Home Values in the Area
Average Home Value in this Area
Purchase History
| Date | Buyer | Sale Price | Title Company |
|---|---|---|---|
| Webb David Alan | $22,000 | None Available | |
| Webb Jerriann | $2,000 | None Available | |
| Webb David Alan | $106,000 | None Available | |
| Benfield Robert W | $90,000 | None Available |
Source: Public Records
Mortgage History
| Date | Status | Borrower | Loan Amount |
|---|---|---|---|
| Previous Owner | Webb David Alan | $82,150 | |
| Previous Owner | Webb David Alan | $95,300 |
Source: Public Records
Tax History Compared to Growth
Tax History
| Year | Tax Paid | Tax Assessment Tax Assessment Total Assessment is a certain percentage of the fair market value that is determined by local assessors to be the total taxable value of land and additions on the property. | Land | Improvement |
|---|---|---|---|---|
| 2024 | $1,308 | $148,761 | $34,637 | $114,124 |
| 2023 | $1,352 | $148,761 | $34,637 | $114,124 |
| 2022 | $1,138 | $102,051 | $23,201 | $78,850 |
| 2021 | $1,132 | $102,051 | $23,201 | $78,850 |
| 2020 | $1,138 | $102,051 | $23,201 | $78,850 |
| 2019 | $1,138 | $102,051 | $23,201 | $78,850 |
| 2018 | $1,137 | $100,009 | $23,201 | $76,808 |
| 2017 | $1,145 | $100,009 | $23,201 | $76,808 |
| 2016 | $1,195 | $100,009 | $23,201 | $76,808 |
| 2015 | $1,147 | $100,009 | $23,201 | $76,808 |
| 2014 | $1,041 | $100,009 | $23,201 | $76,808 |
| 2013 | $1,041 | $100,009 | $23,201 | $76,808 |
Source: Public Records
Map
Nearby Homes
- 109 Turkey Tail Ln Unit 8 & 10
- 113 N Park Dr Unit 11 & 12
- 0 N Park Dr Unit 7 CAR4185864
- 0 N Park Dr Unit 6
- 1077 Greene Ct Unit 34
- 1113 Greene Ct Unit 36
- 1119 Greene Ct Unit 37
- 53 Hennessee St
- 192 Old Lumber Yard Rd
- 106 S River Glen Dr
- 105 S River Glen Dr
- 225 Forest Glen Way
- 413 London St
- 240 Doe Run
- 149 River Breeze Dr
- 256 Park Place
- 2040 River Bend Ln
- 209 Eagles Landing
- 999 River Breeze Dr Unit 10
- tbd River Breeze Dr Unit 11