Estimated Value: $372,000 - $510,000
4
Beds
4
Baths
2,979
Sq Ft
$143/Sq Ft
Est. Value
About This Home
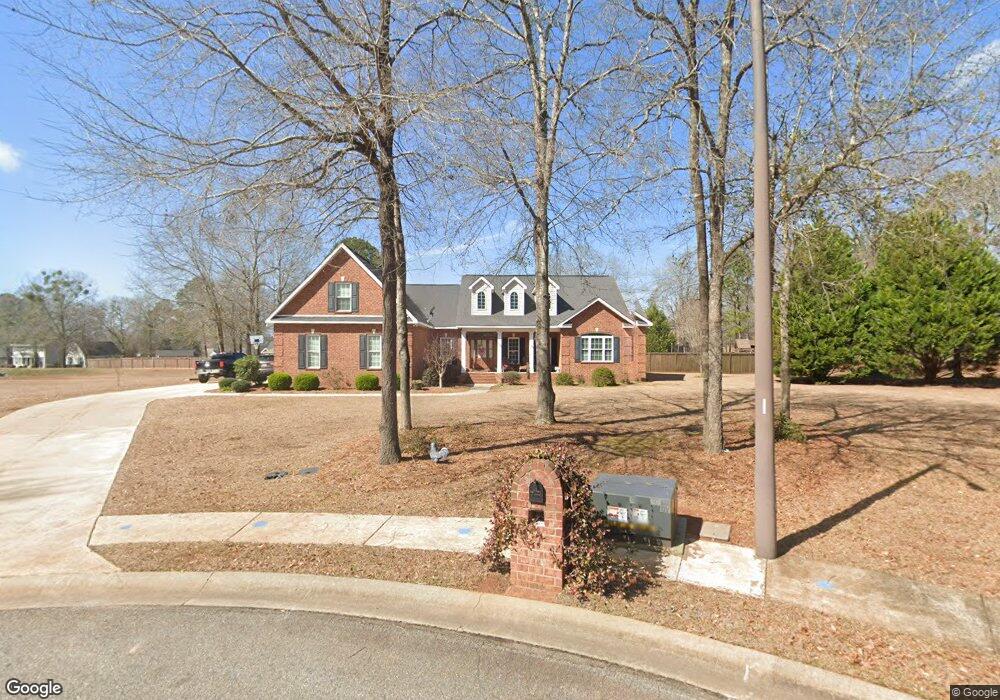
This home is located at 105 Cobble Dr, Perry, GA 31069 and is currently estimated at $427,278, approximately $143 per square foot. 105 Cobble Dr is a home located in Houston County with nearby schools including Morningside Elementary School, Perry Middle School, and Perry High School.
Ownership History
Date
Name
Owned For
Owner Type
Purchase Details
Closed on
May 18, 2015
Sold by
Shaw Amber J
Bought by
Shaw Jason D and Shaw Amber J
Current Estimated Value
Home Financials for this Owner
Home Financials are based on the most recent Mortgage that was taken out on this home.
Original Mortgage
$80,000
Outstanding Balance
$61,874
Interest Rate
3.79%
Mortgage Type
New Conventional
Estimated Equity
$365,404
Purchase Details
Closed on
Sep 18, 2014
Sold by
Jordan Delia E
Bought by
Shaw Amber J
Purchase Details
Closed on
Jun 28, 2013
Sold by
Williams Hubert A and Williams Charlene W
Bought by
Jordan Michael and Jordan Delia E
Home Financials for this Owner
Home Financials are based on the most recent Mortgage that was taken out on this home.
Original Mortgage
$175,000
Interest Rate
3.79%
Mortgage Type
New Conventional
Purchase Details
Closed on
May 17, 2005
Sold by
Williams Hubert A
Bought by
Williams Hubert A and Williams Charlene W
Create a Home Valuation Report for This Property
The Home Valuation Report is an in-depth analysis detailing your home's value as well as a comparison with similar homes in the area
Home Values in the Area
Average Home Value in this Area
Purchase History
| Date | Buyer | Sale Price | Title Company |
|---|---|---|---|
| Shaw Jason D | -- | -- | |
| Shaw Amber J | -- | -- | |
| Jordan Michael | $250,000 | -- | |
| Williams Hubert A | -- | None Available | |
| Williams Hubert A | $32,000 | None Available |
Source: Public Records
Mortgage History
| Date | Status | Borrower | Loan Amount |
|---|---|---|---|
| Open | Shaw Jason D | $80,000 | |
| Previous Owner | Jordan Michael | $175,000 |
Source: Public Records
Tax History
| Year | Tax Paid | Tax Assessment Tax Assessment Total Assessment is a certain percentage of the fair market value that is determined by local assessors to be the total taxable value of land and additions on the property. | Land | Improvement |
|---|---|---|---|---|
| 2024 | $4,509 | $122,720 | $10,000 | $112,720 |
| 2023 | $3,767 | $101,840 | $10,000 | $91,840 |
| 2022 | $2,188 | $95,160 | $10,000 | $85,160 |
| 2021 | $2,059 | $89,080 | $10,000 | $79,080 |
| 2020 | $1,922 | $82,720 | $10,000 | $72,720 |
| 2019 | $1,922 | $82,720 | $10,000 | $72,720 |
| 2018 | $1,922 | $82,720 | $10,000 | $72,720 |
| 2017 | $1,924 | $82,720 | $10,000 | $72,720 |
| 2016 | $1,927 | $82,720 | $10,000 | $72,720 |
| 2015 | $1,847 | $79,120 | $10,000 | $69,120 |
| 2014 | -- | $83,920 | $10,000 | $73,920 |
| 2013 | -- | $83,920 | $10,000 | $73,920 |
Source: Public Records
Map
Nearby Homes
- 1015 Cherokee Rd
- 110 Gwendolyn Ave
- 206 Londie Ln
- 206 Londe Ln
- 500 Legacy Park Dr
- 105 Eagles Ridge Ct
- 102 N Haven Ln
- 204 Sutton Dr
- 206 Sutton Dr
- 106 Raspberry Trail
- 101 Lighterknot Trail
- 114 Sutton Dr
- 309 E River Cane Run
- 102 Ridge Cir N
- 111 Tyndall Way
- Trract 20A Perry Pkwy
- Tract 20-B Perry Pkwy
- Tract 20-A Perry Pkwy
- 118 Farmers Way
- 108 Christine Cir
- 103 Cobble Dr
- 214 Legacy Park Dr
- 106 Cobble Dr
- 300 Legacy Park Dr
- 212 Legacy Park Dr
- 246 Legacy Park Dr
- 404 Yorktown Dr
- 104 Cobble Dr
- 402 Yorktown Dr
- 400 Yorktown Dr
- 302 Legacy Park Dive Unit 10
- 302 Legacy Park Dr
- 302 Legacy Park Dr Unit 10
- 102 Cobble Dr
- 210 Legacy Park Dr
- 314 Waxmyrtle Way Unit 7E
- 318 Wax Myrtle Way
- 332 Wax Myrtle Way Unit Homesite 16E
- 332 Wax Myrtle Way Unit 16E
- 334 Wax Myrtle Way Unit Homesite 17E
Your Personal Tour Guide
Ask me questions while you tour the home.