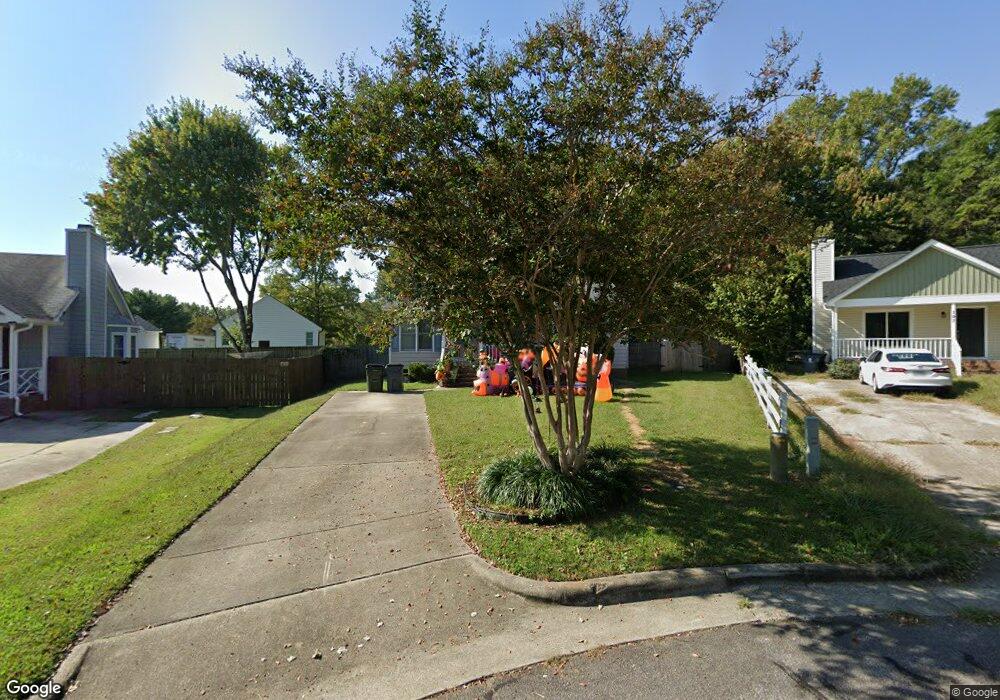
105 Count Gregory Ct Knightdale, NC 27545
Estimated Value: $253,000 - $277,382
3
Beds
2
Baths
1,008
Sq Ft
$265/Sq Ft
Est. Value
About This Home
This home is located at 105 Count Gregory Ct, Knightdale, NC 27545 and is currently estimated at $267,346, approximately $265 per square foot. 105 Count Gregory Ct is a home located in Wake County with nearby schools including Knightdale Elementary School, Neuse River Middle School, and Knightdale High.
Ownership History
Date
Name
Owned For
Owner Type
Purchase Details
Closed on
Jun 22, 2020
Sold by
Graham Carol E
Bought by
Graham Nisaun
Current Estimated Value
Purchase Details
Closed on
May 31, 2016
Sold by
Nolen Gail G and Ray Gail G
Bought by
Reyes Nancy M
Home Financials for this Owner
Home Financials are based on the most recent Mortgage that was taken out on this home.
Original Mortgage
$114,000
Outstanding Balance
$92,688
Interest Rate
4.25%
Mortgage Type
Adjustable Rate Mortgage/ARM
Estimated Equity
$174,658
Purchase Details
Closed on
Sep 5, 2003
Sold by
Nolen Thomas
Bought by
Nolen Gail G and Ray Gail G
Home Financials for this Owner
Home Financials are based on the most recent Mortgage that was taken out on this home.
Original Mortgage
$70,400
Interest Rate
5.94%
Mortgage Type
Purchase Money Mortgage
Purchase Details
Closed on
Jan 5, 1993
Bought by
Nolen Gail G
Create a Home Valuation Report for This Property
The Home Valuation Report is an in-depth analysis detailing your home's value as well as a comparison with similar homes in the area
Home Values in the Area
Average Home Value in this Area
Purchase History
| Date | Buyer | Sale Price | Title Company |
|---|---|---|---|
| Graham Nisaun | -- | None Available | |
| Reyes Nancy M | $112,000 | Chicago Title Insurance Comp | |
| Nolen Gail G | -- | -- | |
| Nolen Gail G | $64,500 | -- |
Source: Public Records
Mortgage History
| Date | Status | Borrower | Loan Amount |
|---|---|---|---|
| Open | Reyes Nancy M | $114,000 | |
| Previous Owner | Nolen Gail G | $70,400 |
Source: Public Records
Tax History Compared to Growth
Tax History
| Year | Tax Paid | Tax Assessment Tax Assessment Total Assessment is a certain percentage of the fair market value that is determined by local assessors to be the total taxable value of land and additions on the property. | Land | Improvement |
|---|---|---|---|---|
| 2025 | $2,636 | $273,320 | $80,000 | $193,320 |
| 2024 | $2,626 | $273,320 | $80,000 | $193,320 |
| 2023 | $1,623 | $144,809 | $30,000 | $114,809 |
| 2022 | $1,569 | $144,809 | $30,000 | $114,809 |
| 2021 | $1,497 | $144,809 | $30,000 | $114,809 |
| 2020 | $1,497 | $144,809 | $30,000 | $114,809 |
| 2019 | $1,121 | $95,650 | $26,000 | $69,650 |
| 2018 | $1,057 | $95,650 | $26,000 | $69,650 |
| 2017 | $1,020 | $95,650 | $26,000 | $69,650 |
| 2016 | $1,006 | $95,650 | $26,000 | $69,650 |
| 2015 | $987 | $92,549 | $30,000 | $62,549 |
| 2014 | $953 | $92,549 | $30,000 | $62,549 |
Source: Public Records
Map
Nearby Homes
- 104 Princess Crescen
- 602 Keith St
- The Burke C Plan at Forestville Yard
- The Avery Exterior Plan at Forestville Yard
- The Mitchell Interior Plan at Forestville Yard
- The Mitchell Exterior Plan at Forestville Yard
- The Avery Interior Plan at Forestville Yard
- The Alexander Plan at Forestville Yard
- 307 S Smithfield Rd
- 665 Wilder Bloom Path
- 658 Wilder Bloom Path
- Jordan Plan at Glenmere - Gardens
- The Willow E Plan at Glenmere - Cove
- 201 Heathwick Dr
- 315 Cedar Pond Ct
- 332 Spruce Pine Trail
- 427 Cedar Pond Ct
- 116 Carrington Dr
- 452 Cedar Pond Ct
- 521 Marion Hills Way
- 107 Count Gregory Ct
- 103 Count Gregory Ct
- 104 Baron Lardon Dr
- 102 Baron Lardon Dr
- 106 Count Gregory Ct
- 203 Kelley Meadows Dr
- 203 Kelley Meadows Rd
- 218 Sallinger St
- 100 Baron Lardon Dr
- 105 Baron Lardon Dr
- 104 Count Gregory Ct
- 212 Sallinger St
- 102 Count Gregory Ct
- 302 Sallinger St
- 100 Count Gregory Ct
- 208 Sallinger St
- 7743 Kelley Meadows Dr
- 0000 Kelley Meadows Dr
- 0 Kelley Meadows Dr Unit 1767121
- 0 Kelley Meadows Dr