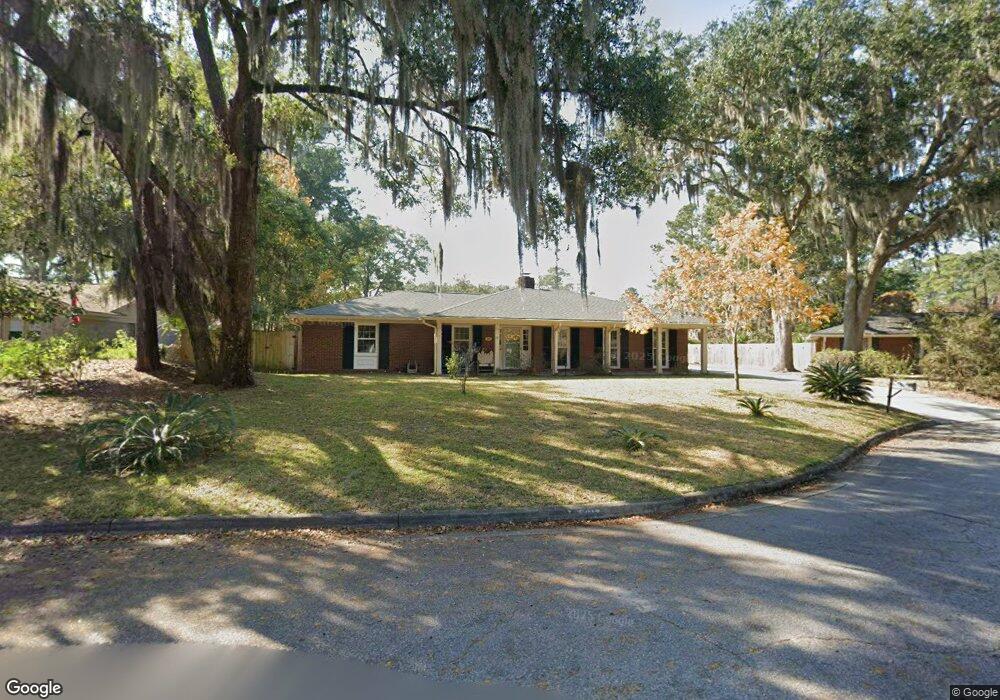
105 Cromwell Ct Savannah, GA 31410
Estimated Value: $516,000 - $541,000
3
Beds
2
Baths
1,943
Sq Ft
$272/Sq Ft
Est. Value
About This Home
This home is located at 105 Cromwell Ct, Savannah, GA 31410 and is currently estimated at $528,939, approximately $272 per square foot. 105 Cromwell Ct is a home located in Chatham County with nearby schools including Howard Elementary School, Coastal Middle School, and Islands High School.
Ownership History
Date
Name
Owned For
Owner Type
Purchase Details
Closed on
Sep 21, 2023
Sold by
Roger Kimberly
Bought by
Roger Daniel and Roger Kimberly
Current Estimated Value
Purchase Details
Closed on
May 26, 2023
Sold by
Lasik Martha Jane
Bought by
Roger Kimberly and Roger Daniel
Purchase Details
Closed on
Sep 4, 2020
Sold by
Harrison Porter T
Bought by
Lasik Dennis and Lasik Martha Jane
Home Financials for this Owner
Home Financials are based on the most recent Mortgage that was taken out on this home.
Original Mortgage
$270,000
Interest Rate
2.8%
Mortgage Type
New Conventional
Purchase Details
Closed on
Sep 14, 2015
Sold by
Land June Baker
Bought by
Harrison Alice L and Harrison Porter T
Home Financials for this Owner
Home Financials are based on the most recent Mortgage that was taken out on this home.
Original Mortgage
$181,000
Interest Rate
3.97%
Mortgage Type
New Conventional
Create a Home Valuation Report for This Property
The Home Valuation Report is an in-depth analysis detailing your home's value as well as a comparison with similar homes in the area
Home Values in the Area
Average Home Value in this Area
Purchase History
| Date | Buyer | Sale Price | Title Company |
|---|---|---|---|
| Roger Daniel | -- | -- | |
| Roger Kimberly | $507,000 | -- | |
| Lasik Dennis | $300,000 | -- | |
| Harrison Alice L | $256,000 | -- |
Source: Public Records
Mortgage History
| Date | Status | Borrower | Loan Amount |
|---|---|---|---|
| Previous Owner | Lasik Dennis | $270,000 | |
| Previous Owner | Harrison Alice L | $181,000 |
Source: Public Records
Tax History Compared to Growth
Tax History
| Year | Tax Paid | Tax Assessment Tax Assessment Total Assessment is a certain percentage of the fair market value that is determined by local assessors to be the total taxable value of land and additions on the property. | Land | Improvement |
|---|---|---|---|---|
| 2025 | $5,483 | $152,560 | $27,720 | $124,840 |
| 2024 | $5,483 | $153,640 | $27,720 | $125,920 |
| 2023 | $1,614 | $116,160 | $27,720 | $88,440 |
| 2022 | $2,702 | $107,640 | $27,720 | $79,920 |
| 2021 | $4,892 | $89,280 | $27,720 | $61,560 |
| 2020 | $2,565 | $80,400 | $27,720 | $52,680 |
| 2019 | $2,686 | $80,400 | $27,720 | $52,680 |
| 2018 | $2,300 | $79,560 | $27,720 | $51,840 |
| 2017 | $2,255 | $81,000 | $27,720 | $53,280 |
| 2016 | $2,334 | $81,360 | $27,720 | $53,640 |
| 2015 | $4,033 | $74,720 | $27,720 | $47,000 |
| 2014 | $4,450 | $88,840 | $0 | $0 |
Source: Public Records
Map
Nearby Homes
- 111 Carlton Rd
- 17 N Cromwell Rd
- 35 Clarendon Rd
- 1912 Stone St
- 11 Mary Musgrove Dr
- 229 Island Creek Ln
- 235 Island Creek Ln
- 127 Druid Cir
- 128 Mary Musgrove Dr
- 412 Olde Towne Rd
- 12 Cromwell Place
- 209 Deerwood Rd
- 401 N Cromwell Rd Unit 2Q
- 401 N Cromwell Rd Unit F6
- 401 N Cromwell Rd Unit T-5
- 401 N Cromwell Rd Unit Q2
- 401 N Cromwell Rd Unit F-5
- 401 N Cromwell Rd Unit Q7
- 700 Wilmington Island Rd Unit 200
- 700 Wilmington Island Rd Unit 201
- 105 Cromwell Ct
- 103 Cromwell Ct
- 103 Cromwell Ct
- 122 Grosvenor Ct
- 107 Cromwell Ct
- 107 Cromwell Ct
- 120 Grosvenor Ct
- 101 Cromwell Ct
- 106 Cromwell Ct
- 124 Grosvenor Ct
- 110 Cromwell Ct
- 110 Cromwell Ct
- 108 Cromwell Ct
- 108 Cromwell Ct
- 118 Grosvenor Ct
- 104 Cromwell Ct
- 104 Cromwell Ct
- 102 Cromwell Ct
- 102 Cromwell Ct
- 123 Grosvenor Ct