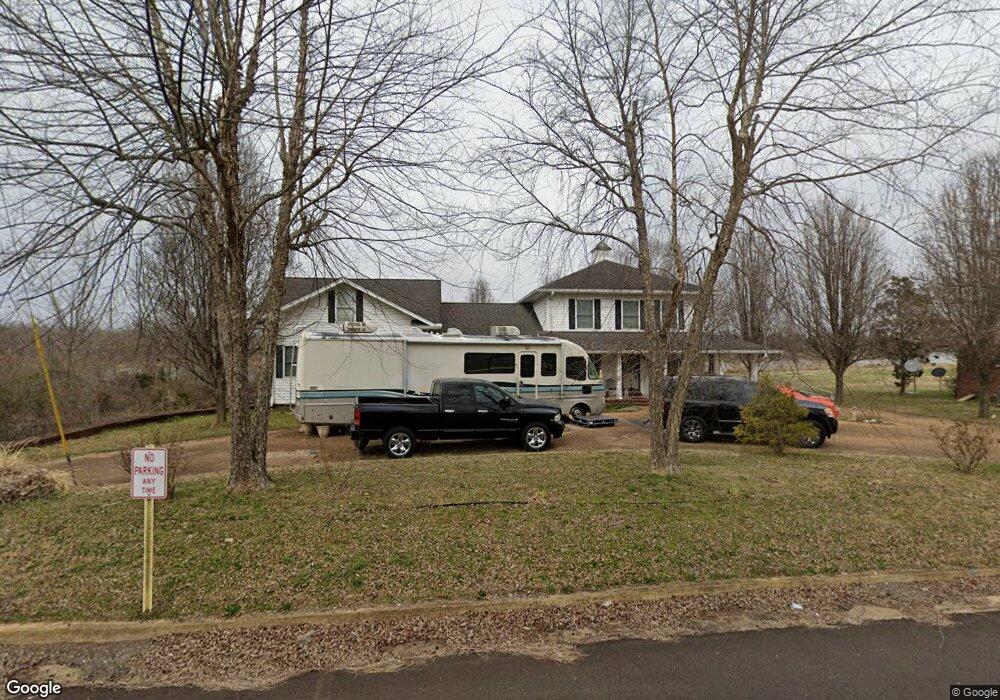
105 Cypress St Clifton, TN 38425
Estimated Value: $289,000 - $723,000
--
Bed
3
Baths
2,806
Sq Ft
$185/Sq Ft
Est. Value
About This Home
This home is located at 105 Cypress St, Clifton, TN 38425 and is currently estimated at $518,964, approximately $184 per square foot. 105 Cypress St is a home located in Wayne County.
Ownership History
Date
Name
Owned For
Owner Type
Purchase Details
Closed on
Aug 11, 2025
Sold by
Argo Sheila Dian
Bought by
Argo Lincoln Chase
Current Estimated Value
Purchase Details
Closed on
Jul 29, 2008
Sold by
Regions Bank
Bought by
Sheila Argo
Home Financials for this Owner
Home Financials are based on the most recent Mortgage that was taken out on this home.
Original Mortgage
$171,941
Interest Rate
6.31%
Purchase Details
Closed on
Jul 25, 2008
Sold by
Mcdaniel Benny H
Bought by
Regions Bank
Home Financials for this Owner
Home Financials are based on the most recent Mortgage that was taken out on this home.
Original Mortgage
$171,941
Interest Rate
6.31%
Purchase Details
Closed on
Jan 25, 2008
Bought by
Regions Bank
Purchase Details
Closed on
Jun 12, 2002
Sold by
Dan Oldaker and Dan Gwen
Bought by
Mcdaniel Benny H and Mcdaniel Fronita
Purchase Details
Closed on
Jun 12, 2000
Bought by
Oldaker Dan Gwynlyn Y
Purchase Details
Closed on
Nov 16, 1987
Bought by
Hendrix William H and Hendrix Margaret G
Purchase Details
Closed on
May 29, 1982
Purchase Details
Closed on
Jul 19, 1976
Create a Home Valuation Report for This Property
The Home Valuation Report is an in-depth analysis detailing your home's value as well as a comparison with similar homes in the area
Home Values in the Area
Average Home Value in this Area
Purchase History
| Date | Buyer | Sale Price | Title Company |
|---|---|---|---|
| Argo Lincoln Chase | -- | None Listed On Document | |
| Sheila Argo | $319,000 | -- | |
| Regions Bank | -- | -- | |
| Regions Bank | $181,500 | -- | |
| Mcdaniel Benny H | $180,000 | -- | |
| Oldaker Dan Gwynlyn Y | $120,000 | -- | |
| Hendrix William H | -- | -- | |
| -- | -- | -- | |
| -- | -- | -- |
Source: Public Records
Mortgage History
| Date | Status | Borrower | Loan Amount |
|---|---|---|---|
| Previous Owner | Not Available | $171,941 | |
| Previous Owner | Not Available | $171,941 |
Source: Public Records
Tax History Compared to Growth
Tax History
| Year | Tax Paid | Tax Assessment Tax Assessment Total Assessment is a certain percentage of the fair market value that is determined by local assessors to be the total taxable value of land and additions on the property. | Land | Improvement |
|---|---|---|---|---|
| 2024 | $1,700 | $78,425 | $11,250 | $67,175 |
| 2023 | $2,210 | $78,425 | $11,250 | $67,175 |
| 2022 | $2,268 | $84,850 | $11,250 | $73,600 |
| 2021 | $2,023 | $84,850 | $11,250 | $73,600 |
| 2020 | $2,086 | $63,225 | $10,250 | $52,975 |
| 2019 | $1,454 | $63,225 | $10,250 | $52,975 |
| 2018 | $2,086 | $63,225 | $10,250 | $52,975 |
| 2017 | $2,086 | $63,225 | $10,250 | $52,975 |
| 2016 | $1,708 | $63,225 | $10,250 | $52,975 |
| 2015 | $1,593 | $63,225 | $10,250 | $52,975 |
| 2014 | $1,593 | $58,623 | $0 | $0 |
Source: Public Records
Map
Nearby Homes
- 0 Main St
- 330 Jett Dr
- 701 James K Polk St W
- 000 Linden Hwy
- 00 Riverview Rd
- LOTS 41-52 Chaparral(off Tom Baker Rd) Ln
- 0 Tennessee 114
- 125 Airport Rd
- 116 Sunset Dr
- 650 W Pillow St
- 980 Skyline Dr
- 51 Billy Nance Hwy
- 198 Treece Ln
- 625 River Rd
- 628 River Rd
- 219 Tn River Estates Rd
- Lot 32 Scenic Ln
- 639 River Rd
- Lot 33 Scenic Ln
- 721 Tn River Estates Rd
- 102 Cypress St
- 1 Cypress St
- 0 Cypress St
- 509 E Water St E
- xxx Cypress St
- 101 Cypress St
- 405 E Water St
- 414 E Water St
- 414 E Water St
- 400 E Water St
- 0 E Water St Unit 10187250
- 0 E Water St Unit RTC2240635
- 0 E Water St Unit RTC2240600
- 0 E Water St
- 207 Ts Stribling Ln
- 401 E Water St
- 309 E Water St
- 303 E Water St
- 114 Ts Stribling Ln
- 302 E Water St