105 Edgeview Dr Shelbyville, TN 37160
Estimated Value: $299,400 - $338,000
--
Bed
2
Baths
1,435
Sq Ft
$218/Sq Ft
Est. Value
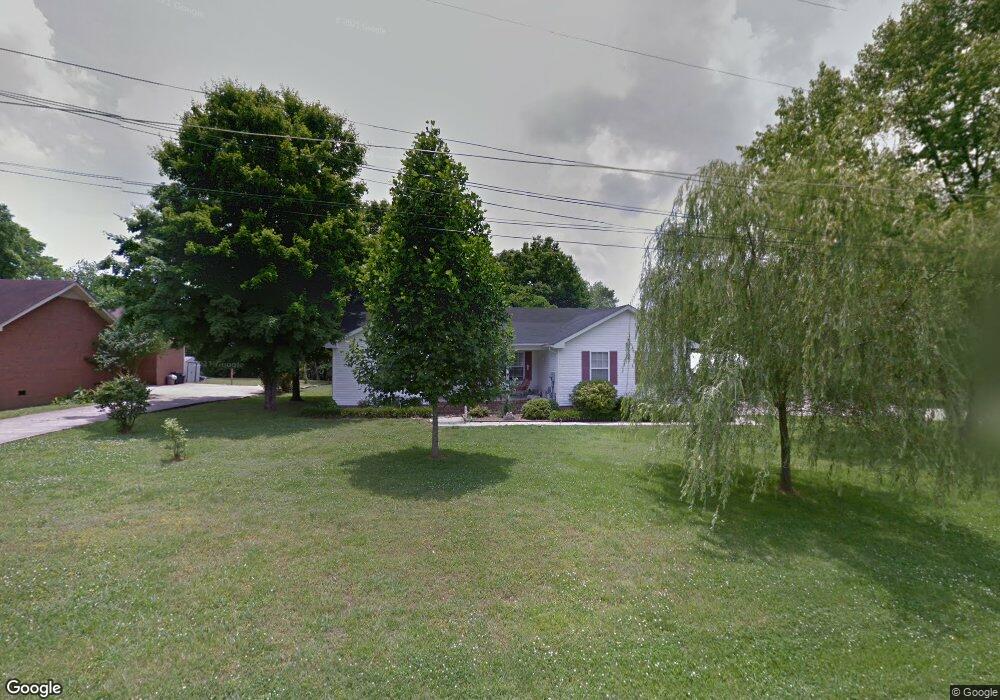
About This Home
This home is located at 105 Edgeview Dr, Shelbyville, TN 37160 and is currently estimated at $313,350, approximately $218 per square foot. 105 Edgeview Dr is a home located in Bedford County with nearby schools including South Side Elementary School, Harris Middle School, and Christian Chapel Academy.
Ownership History
Date
Name
Owned For
Owner Type
Purchase Details
Closed on
May 31, 2000
Sold by
Roberts Joseph David
Bought by
Prater James M and Prater Barbara
Current Estimated Value
Purchase Details
Closed on
Apr 30, 1998
Sold by
Glover G G Elsie
Bought by
Stricklin Rachel
Purchase Details
Closed on
Apr 6, 1998
Sold by
Glover G G Elsie
Bought by
Glover G G Elsie
Purchase Details
Closed on
Dec 30, 1997
Bought by
Glover G G Elsie
Purchase Details
Closed on
Nov 11, 1987
Bought by
Gunter Kevin D
Create a Home Valuation Report for This Property
The Home Valuation Report is an in-depth analysis detailing your home's value as well as a comparison with similar homes in the area
Home Values in the Area
Average Home Value in this Area
Purchase History
| Date | Buyer | Sale Price | Title Company |
|---|---|---|---|
| Prater James M | $87,900 | -- | |
| Stricklin Rachel | $81,000 | -- | |
| Glover G G Elsie | $11,000 | -- | |
| Glover G G Elsie | $11,000 | -- | |
| Gunter Kevin D | $9,000 | -- |
Source: Public Records
Tax History Compared to Growth
Tax History
| Year | Tax Paid | Tax Assessment Tax Assessment Total Assessment is a certain percentage of the fair market value that is determined by local assessors to be the total taxable value of land and additions on the property. | Land | Improvement |
|---|---|---|---|---|
| 2025 | -- | $52,375 | $0 | $0 |
| 2024 | -- | $52,375 | $17,500 | $34,875 |
| 2023 | $1,993 | $52,375 | $17,500 | $34,875 |
| 2022 | $2,051 | $52,375 | $17,500 | $34,875 |
| 2021 | $1,862 | $52,375 | $17,500 | $34,875 |
| 2020 | $1,311 | $52,375 | $17,500 | $34,875 |
| 2019 | $1,306 | $29,475 | $5,750 | $23,725 |
| 2018 | $1,277 | $29,475 | $5,750 | $23,725 |
| 2017 | $1,277 | $29,475 | $5,750 | $23,725 |
| 2016 | $1,265 | $29,475 | $5,750 | $23,725 |
| 2015 | $1,264 | $29,475 | $5,750 | $23,725 |
| 2014 | $1,155 | $29,469 | $0 | $0 |
Source: Public Records
Map
Nearby Homes