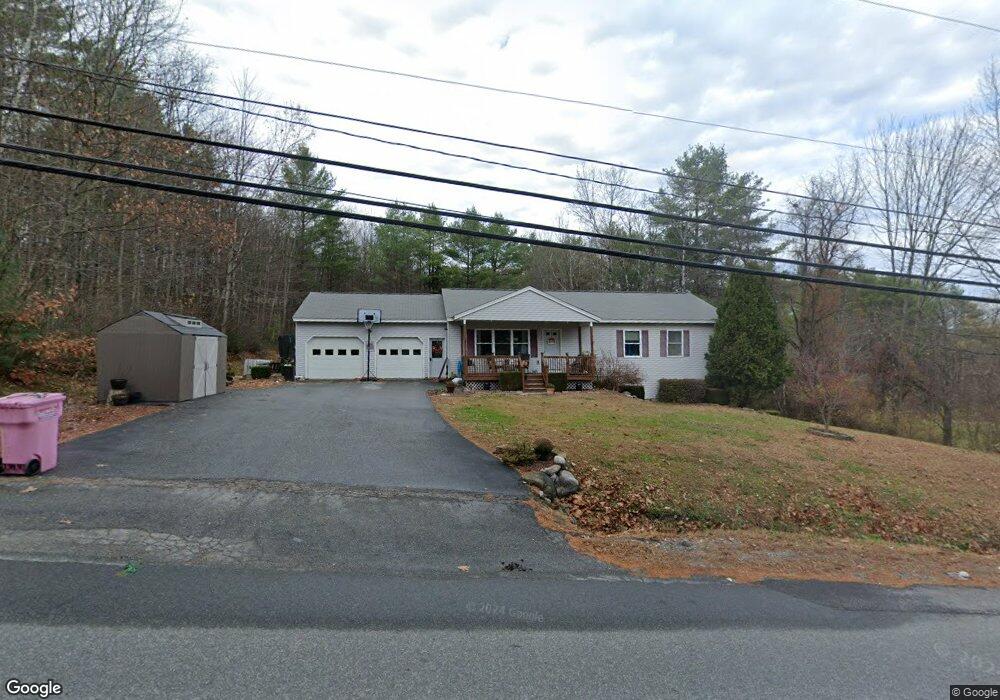
105 Elm St Newport, NH 03773
Estimated Value: $372,000 - $433,000
3
Beds
2
Baths
2,305
Sq Ft
$178/Sq Ft
Est. Value
About This Home
This home is located at 105 Elm St, Newport, NH 03773 and is currently estimated at $409,201, approximately $177 per square foot. 105 Elm St is a home located in Sullivan County with nearby schools including Richards Elementary School, Newport High School, and Newport Montessori School.
Ownership History
Date
Name
Owned For
Owner Type
Purchase Details
Closed on
Jan 16, 2019
Sold by
Seymour Jennifer L
Bought by
Ranney Kyle
Current Estimated Value
Home Financials for this Owner
Home Financials are based on the most recent Mortgage that was taken out on this home.
Original Mortgage
$171,690
Outstanding Balance
$151,255
Interest Rate
4.7%
Mortgage Type
Purchase Money Mortgage
Estimated Equity
$257,946
Purchase Details
Closed on
Nov 23, 2016
Sold by
Ranney Kyle A
Bought by
Ranney Jennifer L
Create a Home Valuation Report for This Property
The Home Valuation Report is an in-depth analysis detailing your home's value as well as a comparison with similar homes in the area
Home Values in the Area
Average Home Value in this Area
Purchase History
| Date | Buyer | Sale Price | Title Company |
|---|---|---|---|
| Ranney Kyle | $177,000 | -- | |
| Ranney Jennifer L | -- | -- |
Source: Public Records
Mortgage History
| Date | Status | Borrower | Loan Amount |
|---|---|---|---|
| Open | Ranney Kyle | $171,690 |
Source: Public Records
Tax History Compared to Growth
Tax History
| Year | Tax Paid | Tax Assessment Tax Assessment Total Assessment is a certain percentage of the fair market value that is determined by local assessors to be the total taxable value of land and additions on the property. | Land | Improvement |
|---|---|---|---|---|
| 2024 | $7,743 | $318,500 | $62,100 | $256,400 |
| 2023 | $7,510 | $318,500 | $62,100 | $256,400 |
| 2022 | $6,657 | $318,500 | $62,100 | $256,400 |
| 2021 | $5,448 | $165,100 | $34,400 | $130,700 |
| 2020 | $5,465 | $165,100 | $34,400 | $130,700 |
| 2019 | $5,371 | $165,100 | $34,400 | $130,700 |
| 2018 | $5,019 | $165,100 | $34,400 | $130,700 |
| 2017 | $4,960 | $165,100 | $34,400 | $130,700 |
| 2016 | $5,033 | $175,200 | $33,700 | $141,500 |
| 2015 | $5,125 | $175,200 | $33,700 | $141,500 |
| 2014 | $5,543 | $175,200 | $33,700 | $141,500 |
| 2013 | $5,254 | $175,200 | $33,700 | $141,500 |
Source: Public Records
Map
Nearby Homes