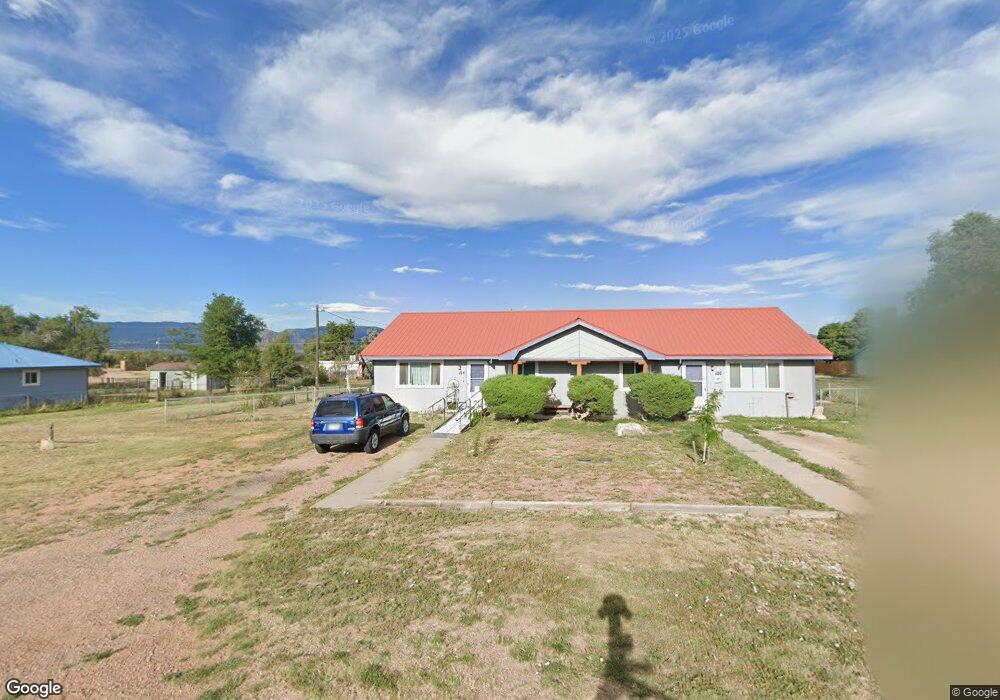
105 Fremont St Penrose, CO 81240
Estimated Value: $223,760
5
Beds
2
Baths
1,984
Sq Ft
$113/Sq Ft
Est. Value
About This Home
This home is located at 105 Fremont St, Penrose, CO 81240 and is currently estimated at $223,760, approximately $112 per square foot. 105 Fremont St is a home with nearby schools including Penrose Elementary School and Florence High School.
Ownership History
Date
Name
Owned For
Owner Type
Purchase Details
Closed on
Nov 18, 2016
Sold by
Summerville James V and Summerville Josephine A
Bought by
Vin Properties2 Llc
Current Estimated Value
Purchase Details
Closed on
Dec 17, 2009
Sold by
Summerville James V and Summerville Josephine A
Bought by
Summerville James V and Summerville Josephine A
Purchase Details
Closed on
Oct 4, 2002
Sold by
Johnson
Bought by
Summerville
Purchase Details
Closed on
Aug 28, 1996
Sold by
Murty
Bought by
Johnson
Purchase Details
Closed on
Aug 26, 1996
Sold by
Murty
Bought by
Johnson
Create a Home Valuation Report for This Property
The Home Valuation Report is an in-depth analysis detailing your home's value as well as a comparison with similar homes in the area
Home Values in the Area
Average Home Value in this Area
Purchase History
| Date | Buyer | Sale Price | Title Company |
|---|---|---|---|
| Vin Properties2 Llc | -- | None Available | |
| Summerville James V | -- | None Available | |
| Summerville | $130,000 | -- | |
| Johnson | -- | -- | |
| Johnson | $92,000 | -- |
Source: Public Records
Tax History Compared to Growth
Tax History
| Year | Tax Paid | Tax Assessment Tax Assessment Total Assessment is a certain percentage of the fair market value that is determined by local assessors to be the total taxable value of land and additions on the property. | Land | Improvement |
|---|---|---|---|---|
| 2024 | $941 | $16,553 | $0 | $0 |
| 2023 | $941 | $12,868 | $0 | $0 |
| 2022 | $1,056 | $14,586 | $0 | $0 |
| 2021 | $1,093 | $15,337 | $0 | $0 |
| 2020 | $630 | $10,327 | $0 | $0 |
| 2019 | $632 | $10,327 | $0 | $0 |
| 2018 | $654 | $10,711 | $0 | $0 |
| 2017 | $656 | $10,711 | $0 | $0 |
| 2016 | $739 | $12,070 | $0 | $0 |
| 2015 | $730 | $12,070 | $0 | $0 |
| 2012 | $747 | $11,389 | $1,672 | $9,717 |
Source: Public Records
Map
Nearby Homes