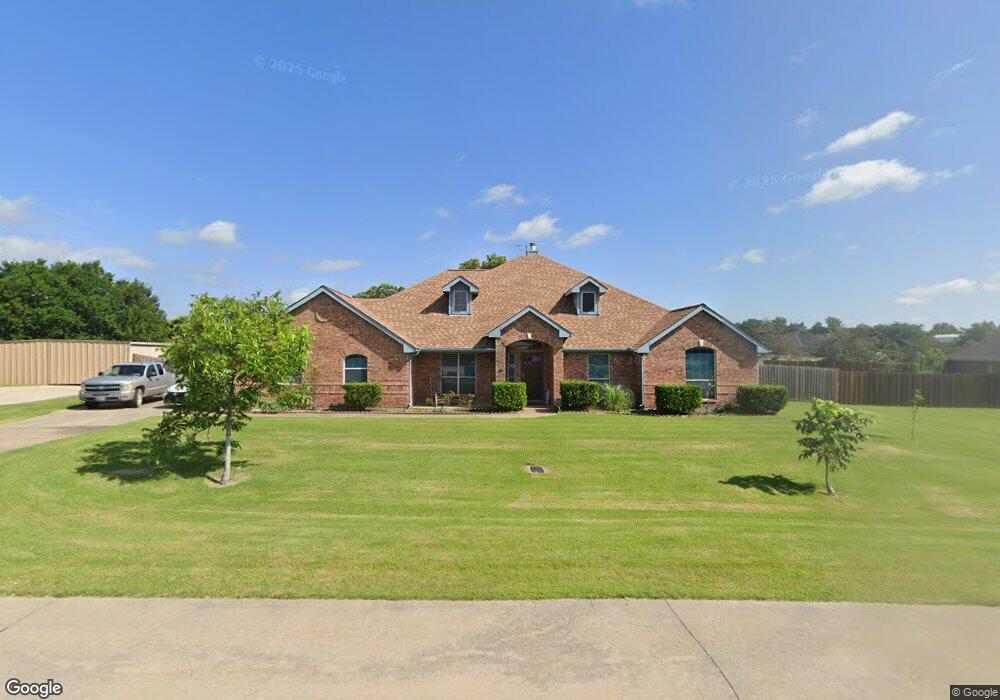
105 Katie St Royse City, TX 75189
Estimated Value: $439,585 - $458,000
4
Beds
2
Baths
2,641
Sq Ft
$170/Sq Ft
Est. Value
About This Home
This home is located at 105 Katie St, Royse City, TX 75189 and is currently estimated at $449,146, approximately $170 per square foot. 105 Katie St is a home located in Rockwall County with nearby schools including Harry H. Herndon Elementary School, Bobby Summers Middle School, and Royse City High School.
Ownership History
Date
Name
Owned For
Owner Type
Purchase Details
Closed on
Sep 14, 2011
Sold by
Gaftiniuc Dorel C and Gaftiniuc Oana I
Bought by
Sunseri Glen Joseph
Current Estimated Value
Home Financials for this Owner
Home Financials are based on the most recent Mortgage that was taken out on this home.
Original Mortgage
$95,000
Outstanding Balance
$65,303
Interest Rate
4.34%
Mortgage Type
New Conventional
Estimated Equity
$383,843
Purchase Details
Closed on
Dec 29, 2005
Sold by
Crestmark Properties Inc
Bought by
Gaftiniuc Dorel C
Home Financials for this Owner
Home Financials are based on the most recent Mortgage that was taken out on this home.
Original Mortgage
$34,400
Interest Rate
6.2%
Mortgage Type
Stand Alone Second
Create a Home Valuation Report for This Property
The Home Valuation Report is an in-depth analysis detailing your home's value as well as a comparison with similar homes in the area
Home Values in the Area
Average Home Value in this Area
Purchase History
| Date | Buyer | Sale Price | Title Company |
|---|---|---|---|
| Sunseri Glen Joseph | -- | Rtt | |
| Gaftiniuc Dorel C | -- | Landamerica American Title |
Source: Public Records
Mortgage History
| Date | Status | Borrower | Loan Amount |
|---|---|---|---|
| Open | Sunseri Glen Joseph | $95,000 | |
| Previous Owner | Gaftiniuc Dorel C | $34,400 | |
| Previous Owner | Gaftiniuc Dorel C | $137,500 |
Source: Public Records
Tax History Compared to Growth
Tax History
| Year | Tax Paid | Tax Assessment Tax Assessment Total Assessment is a certain percentage of the fair market value that is determined by local assessors to be the total taxable value of land and additions on the property. | Land | Improvement |
|---|---|---|---|---|
| 2025 | $5,602 | $426,331 | -- | -- |
| 2023 | $5,602 | $352,340 | $0 | $0 |
| 2022 | $6,500 | $320,309 | $0 | $0 |
| 2021 | $5,973 | $291,190 | $96,300 | $194,890 |
| 2020 | $6,213 | $285,780 | $94,500 | $191,280 |
| 2019 | $6,207 | $271,120 | $66,600 | $204,520 |
| 2018 | $5,921 | $256,200 | $62,400 | $193,800 |
| 2017 | $5,453 | $255,870 | $61,800 | $194,070 |
| 2016 | $4,957 | $227,010 | $60,000 | $167,010 |
| 2015 | $4,368 | $192,820 | $24,000 | $168,820 |
| 2014 | $4,368 | $194,650 | $24,000 | $170,650 |
Source: Public Records
Map
Nearby Homes
- 102 Katie St
- 105 James St
- 428 Attlee Dr
- 1108 Blackland Rd
- 304 Eden Dr
- 227 Chamberlain Dr
- 253 Pitt Cir
- 415 Sedgwick Dr
- 108 Shady Springs Ln
- 407 Sedgwick Dr
- 211 Golden Run Dr
- 134 Blair Dr
- 551 Baker Ct
- 1041 N Churchill Dr
- 557 Baker Ct
- 204 Golden Run Dr
- 411 Sedgwick Dr
- 510 Quapaw Mews
- 569 Baker Ct
- 446 Matador Dr