Estimated Value: $356,000 - $442,000
3
Beds
1
Bath
1,768
Sq Ft
$223/Sq Ft
Est. Value
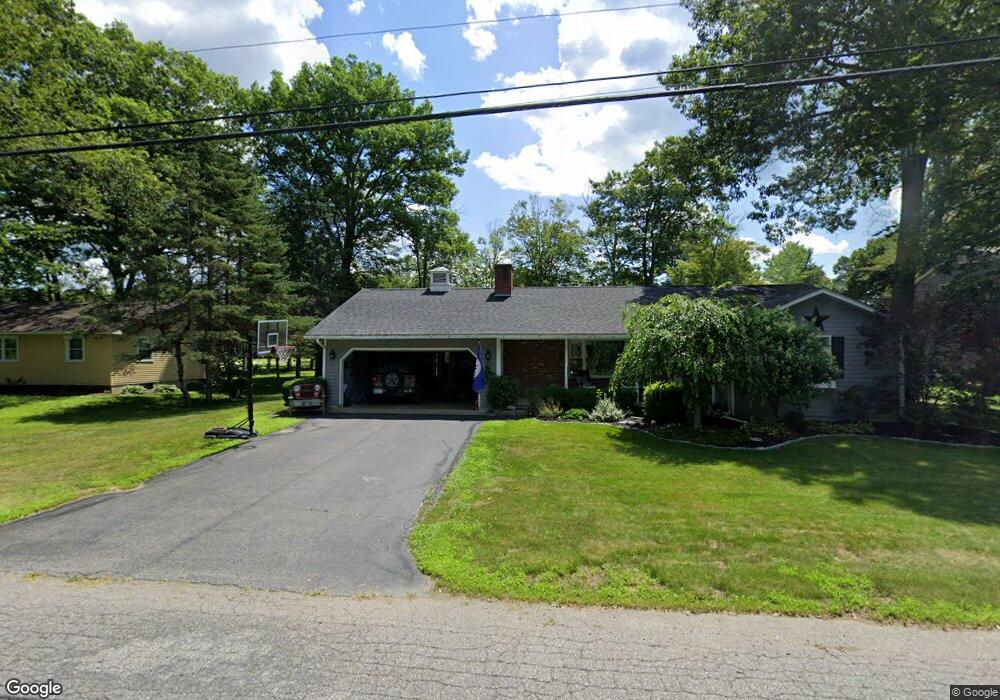
About This Home
This home is located at 105 Kendall Rd, Keene, NH 03431 and is currently estimated at $394,362, approximately $223 per square foot. 105 Kendall Rd is a home located in Cheshire County with nearby schools including Mount Gilead Elementary School, Keene Middle School, and Mayland Early College High School.
Ownership History
Date
Name
Owned For
Owner Type
Purchase Details
Closed on
Mar 3, 2009
Sold by
Liebi George J and Liebi Carol Anne
Bought by
Tiani Mario J and Tiani Michelle D
Current Estimated Value
Home Financials for this Owner
Home Financials are based on the most recent Mortgage that was taken out on this home.
Original Mortgage
$206,196
Interest Rate
5%
Mortgage Type
Purchase Money Mortgage
Purchase Details
Closed on
Sep 27, 2006
Sold by
Burns Charles F and Burns Patricia M
Bought by
Liebl George J and Liebl Carol Anne
Home Financials for this Owner
Home Financials are based on the most recent Mortgage that was taken out on this home.
Original Mortgage
$192,000
Interest Rate
6.52%
Mortgage Type
Purchase Money Mortgage
Purchase Details
Closed on
Dec 1, 1998
Sold by
Allied Associates Inc
Bought by
Burns Charles F and Burns Patricia M
Create a Home Valuation Report for This Property
The Home Valuation Report is an in-depth analysis detailing your home's value as well as a comparison with similar homes in the area
Home Values in the Area
Average Home Value in this Area
Purchase History
| Date | Buyer | Sale Price | Title Company |
|---|---|---|---|
| Tiani Mario J | $210,000 | -- | |
| Liebl George J | $240,000 | -- | |
| Burns Charles F | $128,000 | -- |
Source: Public Records
Mortgage History
| Date | Status | Borrower | Loan Amount |
|---|---|---|---|
| Open | Burns Charles F | $196,274 | |
| Closed | Burns Charles F | $206,196 | |
| Previous Owner | Burns Charles F | $192,000 |
Source: Public Records
Tax History Compared to Growth
Tax History
| Year | Tax Paid | Tax Assessment Tax Assessment Total Assessment is a certain percentage of the fair market value that is determined by local assessors to be the total taxable value of land and additions on the property. | Land | Improvement |
|---|---|---|---|---|
| 2024 | $7,580 | $229,200 | $47,700 | $181,500 |
| 2023 | $7,309 | $229,200 | $47,700 | $181,500 |
| 2022 | $7,112 | $229,200 | $47,700 | $181,500 |
| 2021 | $7,169 | $229,200 | $47,700 | $181,500 |
| 2020 | $7,061 | $189,400 | $55,800 | $133,600 |
| 2019 | $7,121 | $189,400 | $55,800 | $133,600 |
| 2018 | $7,031 | $189,400 | $55,800 | $133,600 |
| 2017 | $7,049 | $189,400 | $55,800 | $133,600 |
| 2016 | $6,892 | $189,400 | $55,800 | $133,600 |
| 2015 | $6,452 | $187,500 | $68,400 | $119,100 |
Source: Public Records
Map
Nearby Homes
- 257 Park Ave
- 18 Stanton Ct
- 45 Blossom St
- 28 Stonehouse Ln
- 110 Arch St Unit 27
- 110 Arch St Unit 42
- 7 Newman St
- 38 Stonehouse Ln Unit A
- 11 Nut Hatch Ln
- 106 Pako Ave
- 17 Blue Jay Ct
- 23 Base Hill Rd
- 792 Court St Unit A
- 798 Court St Unit G
- 39 Windsor Ct Unit B
- 0 Stevens St Unit 1
- 115 Liberty Ln
- 64 Old Walpole Rd
- 67 Woodburn St
- 184 Kennedy Dr