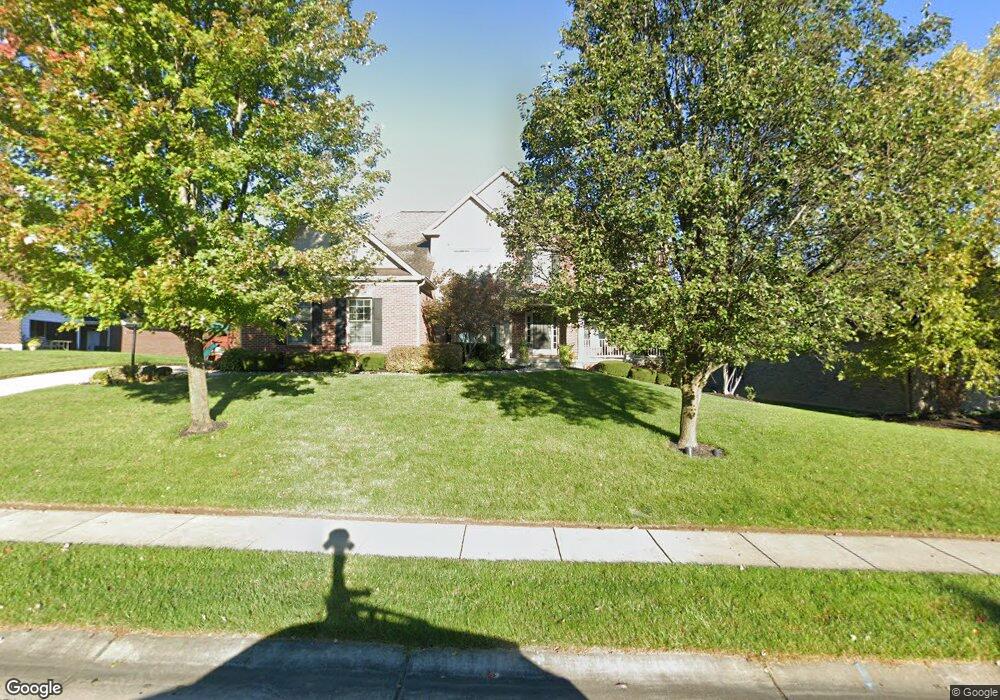
105 Kruempelman Dr Fort Mitchell, KY 41011
Estimated Value: $888,000 - $1,158,000
4
Beds
5
Baths
3,327
Sq Ft
$304/Sq Ft
Est. Value
About This Home
This home is located at 105 Kruempelman Dr, Fort Mitchell, KY 41011 and is currently estimated at $1,010,159, approximately $303 per square foot. 105 Kruempelman Dr is a home located in Kenton County with nearby schools including Beechwood Elementary School, Beechwood High School, and Prince of Peace School.
Ownership History
Date
Name
Owned For
Owner Type
Purchase Details
Closed on
Jun 18, 2010
Sold by
Cartus Financial Corporation
Bought by
Young Joshua E and Young Danica J
Current Estimated Value
Home Financials for this Owner
Home Financials are based on the most recent Mortgage that was taken out on this home.
Original Mortgage
$48,000
Outstanding Balance
$15,878
Interest Rate
4.83%
Mortgage Type
Credit Line Revolving
Estimated Equity
$994,281
Purchase Details
Closed on
May 12, 2005
Sold by
Drees Premier Homes Inc
Bought by
Senneff Steven D and Senneff Aileen Creagh
Home Financials for this Owner
Home Financials are based on the most recent Mortgage that was taken out on this home.
Original Mortgage
$359,650
Interest Rate
4.75%
Mortgage Type
Fannie Mae Freddie Mac
Purchase Details
Closed on
Feb 6, 2004
Sold by
Kfmd Llc
Bought by
Drees Premier Homes Inc
Create a Home Valuation Report for This Property
The Home Valuation Report is an in-depth analysis detailing your home's value as well as a comparison with similar homes in the area
Home Values in the Area
Average Home Value in this Area
Purchase History
| Date | Buyer | Sale Price | Title Company |
|---|---|---|---|
| Young Joshua E | $480,000 | Metro Title Llc | |
| Cartus Financial Corporation | $480,000 | Metro Title Llc | |
| Senneff Steven D | $580,780 | Bluegrass Title Co | |
| Drees Premier Homes Inc | $155,000 | -- |
Source: Public Records
Mortgage History
| Date | Status | Borrower | Loan Amount |
|---|---|---|---|
| Open | Cartus Financial Corporation | $48,000 | |
| Open | Young Joshua E | $384,000 | |
| Previous Owner | Senneff Steven D | $359,650 | |
| Closed | Senneff Steven D | $63,350 |
Source: Public Records
Tax History Compared to Growth
Tax History
| Year | Tax Paid | Tax Assessment Tax Assessment Total Assessment is a certain percentage of the fair market value that is determined by local assessors to be the total taxable value of land and additions on the property. | Land | Improvement |
|---|---|---|---|---|
| 2024 | $3,222 | $826,100 | $165,000 | $661,100 |
| 2023 | $3,362 | $826,100 | $165,000 | $661,100 |
| 2022 | $2,183 | $505,000 | $150,000 | $355,000 |
| 2021 | $2,275 | $505,000 | $150,000 | $355,000 |
| 2020 | $2,335 | $505,000 | $150,000 | $355,000 |
| 2019 | $2,348 | $505,000 | $150,000 | $355,000 |
| 2018 | $2,362 | $505,000 | $150,000 | $355,000 |
| 2017 | $2,306 | $505,000 | $155,000 | $350,000 |
| 2015 | $7,391 | $480,000 | $155,000 | $325,000 |
| 2014 | $2,178 | $480,000 | $155,000 | $325,000 |
Source: Public Records
Map
Nearby Homes
- 10 E Orchard Rd
- 1907 Fortside Cir
- 215 Fort Mitchell Ave Unit 4
- 2001 Pieck Dr
- 108 Kennedy Rd
- 65 W Crittenden Ave
- 114 W Maple Ave
- 1733 Amsterdam Rd
- 81 Kyles Ln
- 1660 Amsterdam Rd
- 1960 Edenderry Dr
- 1753 Stony Point
- 1732 Highland Ave
- 268 Meridian Way
- 272 Meridian Way Unit 8-603
- 274 Meridian Way Unit 8-602
- 270 Meridian Way
- Camden Plan at The Pinnacle at Fort Mitchell - Designer Collection
- 266 Meridian Way Unit 8-606
- 276 Meridian Way Unit 8-601
- 101 Kruempelman Dr
- 115 Kruempelman Dr
- 3 Kruempelman Dr
- 108 Saint Johns Rd
- 121 Kruempelman Dr
- 121 Krumpleman
- 106 Kruempelman Dr Unit 3
- 106 Kruempelman Dr
- 0 Saint Johns Rd Unit 2 298911
- 0 Saint Johns Rd Unit 2
- 112 Saint Johns Rd
- 116 Kruempelman Dr
- 102 Kruempelman Dr Unit 2
- 102 Kruempelman Dr
- 120 Kruempelman Dr
- 112 Kruempelman Dr
- 112 Kruempelman Dr Unit 6
- 125 Kruempelman Dr
- 108 Kruempelman Dr Unit 4
- 108 Kruempelman Dr