Estimated Value: $378,000 - $428,000
6
Beds
3
Baths
3,623
Sq Ft
$111/Sq Ft
Est. Value
About This Home
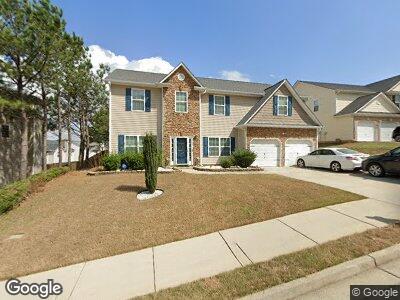
This home is located at 105 Lenore Way, Hiram, GA 30141 and is currently estimated at $401,238, approximately $110 per square foot. 105 Lenore Way is a home located in Paulding County with nearby schools including Hiram Elementary School, P. B. Ritch Middle School, and Hiram High School.
Ownership History
Date
Name
Owned For
Owner Type
Purchase Details
Closed on
Oct 29, 2010
Sold by
Federal Natl Mtg Assn Fnma
Bought by
Neil Anthony H
Current Estimated Value
Home Financials for this Owner
Home Financials are based on the most recent Mortgage that was taken out on this home.
Original Mortgage
$123,239
Outstanding Balance
$83,914
Interest Rate
4.37%
Mortgage Type
FHA
Estimated Equity
$310,113
Purchase Details
Closed on
Jun 1, 2010
Sold by
Bac Home Loans Servicing Lp
Bought by
Federal Natl Mtg Assn Fnma
Purchase Details
Closed on
Jul 21, 2007
Sold by
Wallace Natalee O
Purchase Details
Closed on
Jul 20, 2007
Sold by
Wallace Dave M and Wallace Natalee O
Purchase Details
Closed on
Jul 10, 2006
Sold by
Pine Grove Builders Inc
Bought by
Wallace Dave M and Wallace Natalee O
Home Financials for this Owner
Home Financials are based on the most recent Mortgage that was taken out on this home.
Original Mortgage
$183,330
Interest Rate
9.62%
Mortgage Type
New Conventional
Purchase Details
Closed on
Aug 13, 2005
Sold by
Winstar Development Inc
Purchase Details
Closed on
Aug 12, 2005
Sold by
Wilson Land & Development Corp
Create a Home Valuation Report for This Property
The Home Valuation Report is an in-depth analysis detailing your home's value as well as a comparison with similar homes in the area
Home Values in the Area
Average Home Value in this Area
Purchase History
| Date | Buyer | Sale Price | Title Company |
|---|---|---|---|
| Neil Anthony H | -- | -- | |
| Federal Natl Mtg Assn Fnma | -- | -- | |
| Bac Home Loans Servicing Lp | $157,985 | -- | |
| Wallace Dave M | $203,700 | -- |
Source: Public Records
Mortgage History
| Date | Status | Borrower | Loan Amount |
|---|---|---|---|
| Open | Neil Anthony H | $123,239 | |
| Previous Owner | Wallace Dave M | $183,330 |
Source: Public Records
Tax History Compared to Growth
Tax History
| Year | Tax Paid | Tax Assessment Tax Assessment Total Assessment is a certain percentage of the fair market value that is determined by local assessors to be the total taxable value of land and additions on the property. | Land | Improvement |
|---|---|---|---|---|
| 2024 | $3,808 | $156,316 | $16,000 | $140,316 |
| 2023 | $4,190 | $163,248 | $16,000 | $147,248 |
| 2022 | $3,587 | $139,452 | $12,000 | $127,452 |
| 2021 | $2,891 | $101,344 | $12,000 | $89,344 |
| 2020 | $2,693 | $92,512 | $12,000 | $80,512 |
| 2019 | $2,728 | $92,400 | $12,000 | $80,400 |
| 2018 | $2,513 | $85,260 | $8,000 | $77,260 |
| 2017 | $2,099 | $70,580 | $8,000 | $62,580 |
| 2016 | $2,134 | $72,436 | $8,000 | $64,436 |
| 2015 | $2,172 | $72,440 | $8,000 | $64,440 |
| 2014 | $1,900 | $62,040 | $8,000 | $54,040 |
| 2013 | -- | $49,400 | $8,000 | $41,400 |
Source: Public Records
Map
Nearby Homes
- 105 Lenore Way
- 91 Lenore Way
- 117 Lenore Way
- 31 Joseph Ln
- 147 Lanier Crossing
- 119 Lanier Crossing
- 0 Joseph Ln
- 0 Lenore Way Unit 8680013
- 0 Lenore Way Unit 8823470
- 0 Lenore Way Unit 7065351
- 0 Lenore Way Unit 7121741
- 0 Lenore Way Unit 8707827
- 0 Lenore Way Unit 8990756
- 0 Lenore Way Unit 8863750
- 0 Lenore Way Unit 3226387
- 0 Lenore Way Unit 43 7043264
- 0 Lenore Way
- 108 Lenore Way
- 94 Lenore Way
- 122 Lenore Way Unit 43