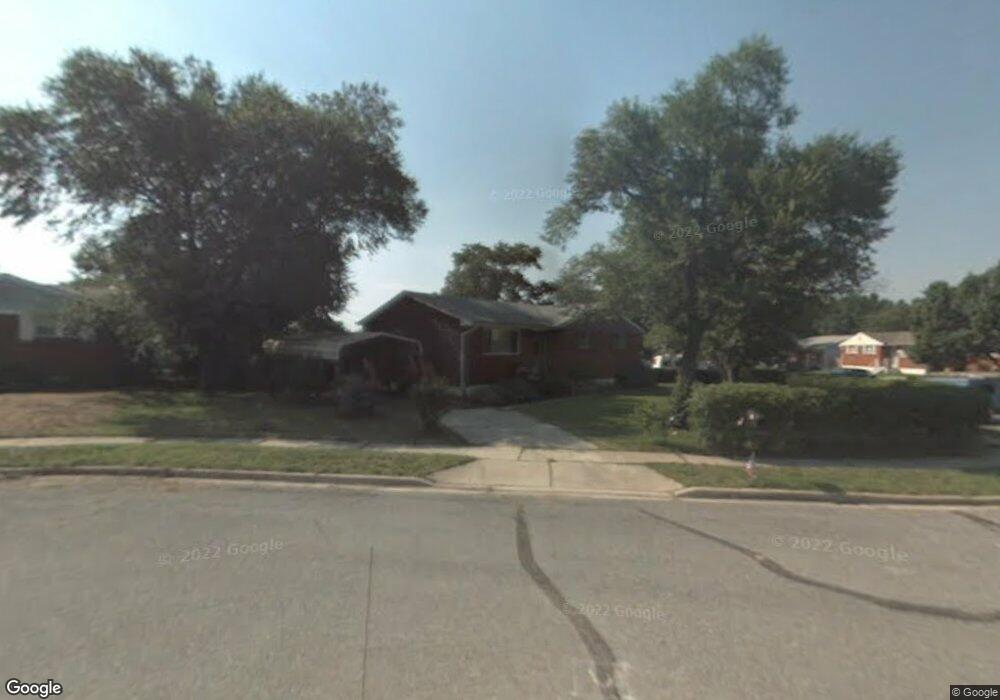
105 Leonard Ct Glen Burnie, MD 21060
Estimated Value: $364,000 - $427,000
--
Bed
1
Bath
1,069
Sq Ft
$361/Sq Ft
Est. Value
About This Home
This home is located at 105 Leonard Ct, Glen Burnie, MD 21060 and is currently estimated at $385,628, approximately $360 per square foot. 105 Leonard Ct is a home located in Anne Arundel County with nearby schools including Freetown Elementary School, Marley Middle School, and Glen Burnie High School.
Ownership History
Date
Name
Owned For
Owner Type
Purchase Details
Closed on
May 9, 2019
Sold by
Burns Georgie Anna and Burns Denny
Bought by
Burns Denny L
Current Estimated Value
Home Financials for this Owner
Home Financials are based on the most recent Mortgage that was taken out on this home.
Original Mortgage
$204,750
Outstanding Balance
$179,282
Interest Rate
4%
Mortgage Type
New Conventional
Estimated Equity
$206,346
Purchase Details
Closed on
Mar 22, 2012
Sold by
Burns Georgie Anna and Burns George A
Bought by
Burns Georgie Anna and Burns Denny
Purchase Details
Closed on
Aug 21, 2000
Sold by
Secretary Of Housing & Urban Dev
Bought by
Burns George A
Purchase Details
Closed on
May 25, 2000
Sold by
Smith Dennis D
Bought by
Secretary Of Housing & Urban Dev
Purchase Details
Closed on
Aug 20, 1998
Sold by
Bayne Larry
Bought by
Smith Dennis D
Create a Home Valuation Report for This Property
The Home Valuation Report is an in-depth analysis detailing your home's value as well as a comparison with similar homes in the area
Home Values in the Area
Average Home Value in this Area
Purchase History
| Date | Buyer | Sale Price | Title Company |
|---|---|---|---|
| Burns Denny L | -- | None Available | |
| Burns Georgie Anna | -- | None Available | |
| Burns George A | $115,011 | -- | |
| Secretary Of Housing & Urban Dev | $130,000 | -- | |
| Smith Dennis D | $124,500 | -- |
Source: Public Records
Mortgage History
| Date | Status | Borrower | Loan Amount |
|---|---|---|---|
| Open | Burns Denny L | $204,750 | |
| Closed | Smith Dennis D | -- |
Source: Public Records
Tax History Compared to Growth
Tax History
| Year | Tax Paid | Tax Assessment Tax Assessment Total Assessment is a certain percentage of the fair market value that is determined by local assessors to be the total taxable value of land and additions on the property. | Land | Improvement |
|---|---|---|---|---|
| 2025 | $3,165 | $296,900 | $160,200 | $136,700 |
| 2024 | $3,165 | $281,833 | $0 | $0 |
| 2023 | $2,593 | $266,767 | $0 | $0 |
| 2022 | $2,853 | $251,700 | $132,900 | $118,800 |
| 2021 | $5,613 | $247,200 | $0 | $0 |
| 2020 | $2,719 | $242,700 | $0 | $0 |
| 2019 | $2,676 | $238,200 | $127,900 | $110,300 |
| 2018 | $2,262 | $223,033 | $0 | $0 |
| 2017 | $1,975 | $207,867 | $0 | $0 |
| 2016 | -- | $192,700 | $0 | $0 |
| 2015 | -- | $189,667 | $0 | $0 |
| 2014 | -- | $186,633 | $0 | $0 |
Source: Public Records
Map
Nearby Homes
- 0 Freetown Rd Unit MDAA2104444
- 118 Mountain Rd Unit 1A
- 1113 Castle Harbour Way Unit 1B
- 7851 Shellye Rd
- 105 Spring Gate Ln
- 320 Sherman Bouyer Ln
- Clarendon 1-Car Garage Plan at The Highlands Townhomes
- Cadence Plan at The Highlands Townhomes
- 7834 Shellye Rd
- 155 Woodgate Cir
- 818 Barbara Ct
- 7947 Lee Hall Rd
- 7828 Spencer Rd
- 312 Caldwell Rd
- 314 Caldwell Rd
- 103 Henson Rd
- 0 Wilkes Ln
- 8013 Long Hill Rd
- 8234 White Star Crossing
- 407 Lily Brook Ct
- 1114 Leonard Dr
- 103 Leonard Ct
- 1112 Leonard Dr
- 103 Cedarcliff Ct
- 101 Cedarcliff Ct
- 101 Leonard Ct
- 1123 Leonard Dr
- 1121 Leonard Dr
- 1125 Leonard Dr
- 1120 Leonard Dr
- 102 Leonard Ct
- 1119 Leonard Dr
- 1110 Leonard Dr
- 1127 Leonard Dr
- 1117 Leonard Dr
- 1135 Cedarcliff Dr
- 1133 Cedarcliff Dr
- 102 Cedarcliff Ct
- 1122 Leonard Dr
- 1129 Leonard Dr