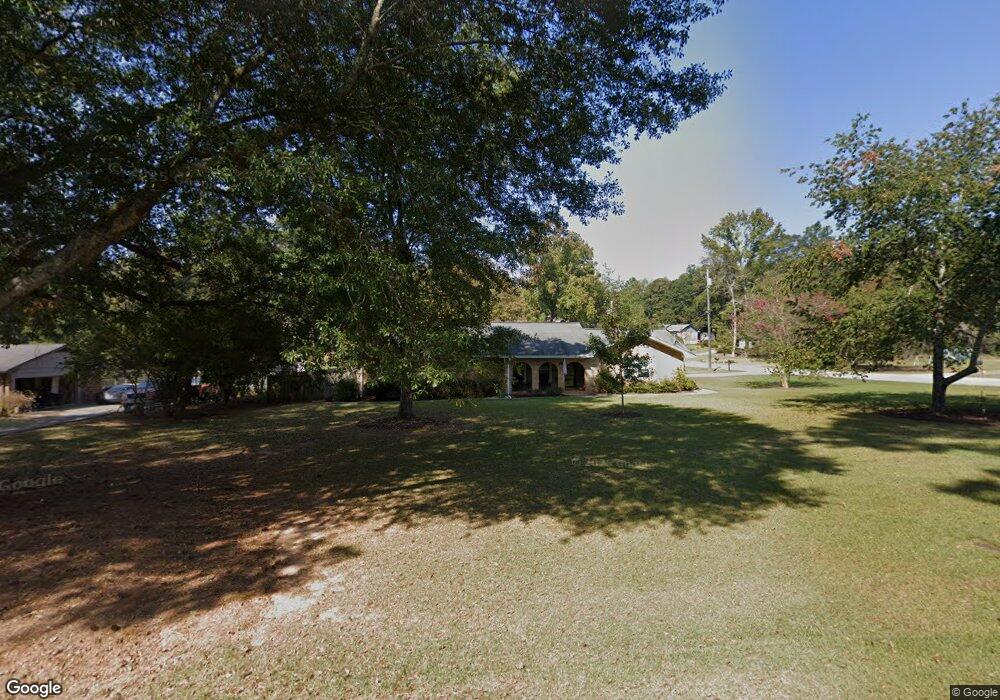
105 N Fairlawn Dr Unit 74 + 1/2 of 75 Carrollton, GA 30117
Estimated Value: $262,112 - $281,000
3
Beds
2
Baths
1,500
Sq Ft
$182/Sq Ft
Est. Value
About This Home
This home is located at 105 N Fairlawn Dr Unit 74 + 1/2 of 75, Carrollton, GA 30117 and is currently estimated at $273,028, approximately $182 per square foot. 105 N Fairlawn Dr Unit 74 + 1/2 of 75 is a home located in Carroll County with nearby schools including Central Elementary School, Central Middle School, and Central High School.
Ownership History
Date
Name
Owned For
Owner Type
Purchase Details
Closed on
Dec 27, 2019
Sold by
Austin Stephen E
Bought by
Kruzinski Donald and Kruzinski Marjorie
Current Estimated Value
Home Financials for this Owner
Home Financials are based on the most recent Mortgage that was taken out on this home.
Original Mortgage
$119,200
Outstanding Balance
$105,318
Interest Rate
3.6%
Mortgage Type
New Conventional
Estimated Equity
$167,710
Purchase Details
Closed on
Jun 29, 2012
Sold by
Louis Everett D
Bought by
Austin Stephen E and Austin Laura M
Purchase Details
Closed on
Jul 2, 2010
Sold by
Hobbs Lori R and Hobbs Moone D
Bought by
Louis Everett D
Purchase Details
Closed on
Sep 17, 1999
Sold by
Shaheen Filamena L
Bought by
Hobbs Lori R and Hobbs N
Purchase Details
Closed on
Oct 4, 1978
Bought by
Shaheen Filamena L
Create a Home Valuation Report for This Property
The Home Valuation Report is an in-depth analysis detailing your home's value as well as a comparison with similar homes in the area
Home Values in the Area
Average Home Value in this Area
Purchase History
| Date | Buyer | Sale Price | Title Company |
|---|---|---|---|
| Kruzinski Donald | $149,000 | -- | |
| Austin Stephen E | $88,500 | -- | |
| Louis Everett D | $95,000 | -- | |
| Hobbs Lori R | $88,300 | -- | |
| Shaheen Filamena L | -- | -- |
Source: Public Records
Mortgage History
| Date | Status | Borrower | Loan Amount |
|---|---|---|---|
| Open | Kruzinski Donald | $119,200 |
Source: Public Records
Tax History Compared to Growth
Tax History
| Year | Tax Paid | Tax Assessment Tax Assessment Total Assessment is a certain percentage of the fair market value that is determined by local assessors to be the total taxable value of land and additions on the property. | Land | Improvement |
|---|---|---|---|---|
| 2024 | $316 | $98,424 | $7,500 | $90,924 |
| 2023 | $316 | $90,170 | $7,500 | $82,670 |
| 2022 | $377 | $73,854 | $7,500 | $66,354 |
| 2021 | $380 | $64,368 | $7,500 | $56,868 |
| 2020 | $381 | $57,728 | $7,500 | $50,228 |
| 2019 | $1,259 | $48,660 | $7,500 | $41,160 |
| 2018 | $981 | $37,349 | $3,000 | $34,349 |
| 2017 | $984 | $37,349 | $3,000 | $34,349 |
| 2016 | $984 | $37,349 | $3,000 | $34,349 |
| 2015 | $922 | $32,977 | $9,000 | $23,978 |
| 2014 | $926 | $32,978 | $9,000 | $23,978 |
Source: Public Records
Map
Nearby Homes
- 0 Bonner Rd Unit 10635754
- 399 Old Camp Church Rd
- 345 Piney Grove Rd
- 105 Woodbine Dr
- 130 Maple Crossing Unit 1
- 130 Maple Crossing Unit LOT 2
- 115 Greenwood Ln
- 394 Maple View Dr
- 390 Maple View Dr
- 20 Camp Ct
- 0 Buffalo Creek Rd Unit 10624169
- 388 Maple View Dr
- 95 Camp Ln
- 108 Briarwood Dr
- 533 Buffalo Creek Rd
- The Coleman Plan at Summerfield Place
- The Pearson Plan at Summerfield Place
- The Piedmont Plan at Summerfield Place
- The Harrington Plan at Summerfield Place
- The McGinnis Plan at Summerfield Place
- 105 N Fairlawn Dr
- 125 N Fairlawn Dr
- 95 N Fairlawn Dr
- 120 N Fairlawn Dr
- 100 N Fairlawn Dr
- 30 Fairlawn Cir
- 135 N Fairlawn Dr
- 25 Fairlawn Cir
- N N Fairlawn Dr Unit 36
- N N Fairlawn Dr
- N N Fairlawn Dr Unit 74 + 1/2 of 75
- 90 N Fairlawn Dr
- 90 N Fairlawn Dr
- 130 N Fairlawn Dr
- 75 N Fairlawn Dr
- 35 Fairlawn Cir
- 40 Fairlawn Cir
- 175 Fairlawn Dr
- 155 Fairlawn Dr
- 70 N Fairlawn Dr