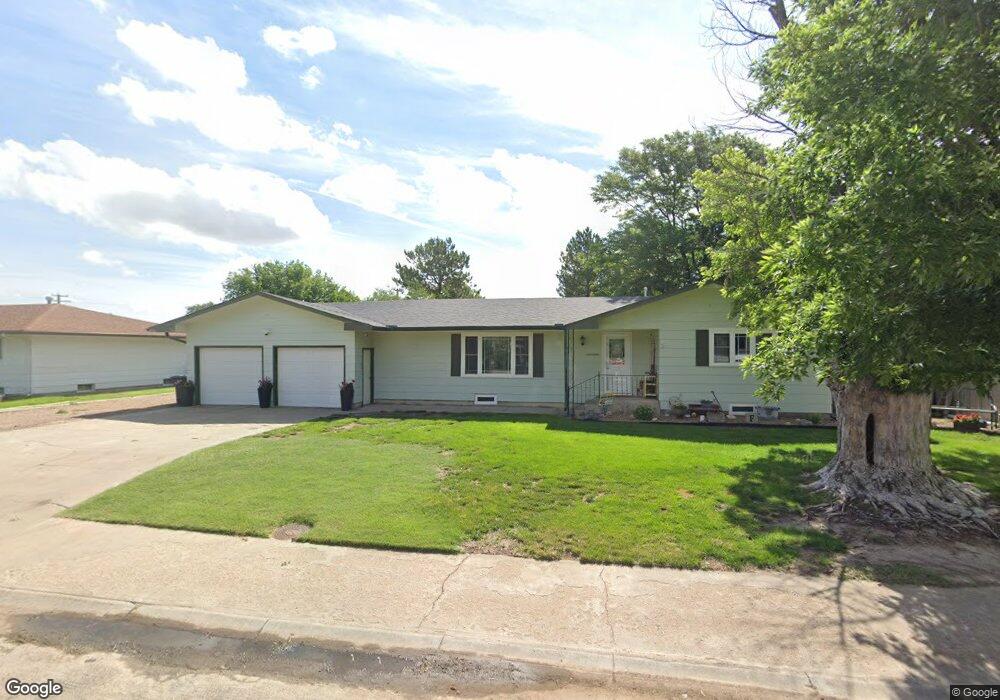
105 N Fry St Montezuma, KS 67867
Estimated Value: $250,000 - $268,000
5
Beds
3
Baths
1,540
Sq Ft
$167/Sq Ft
Est. Value
About This Home
This home is located at 105 N Fry St, Montezuma, KS 67867 and is currently estimated at $257,111, approximately $166 per square foot. 105 N Fry St is a home located in Gray County with nearby schools including Montezuma Elementary School and South Gray High School.
Ownership History
Date
Name
Owned For
Owner Type
Purchase Details
Closed on
Aug 21, 2017
Sold by
Salisbury Norma L and Salisbury Roger L
Bought by
Foskuhl Richard and Foskuhl Amanda
Current Estimated Value
Home Financials for this Owner
Home Financials are based on the most recent Mortgage that was taken out on this home.
Original Mortgage
$146,647
Outstanding Balance
$122,596
Interest Rate
4.03%
Mortgage Type
New Conventional
Estimated Equity
$134,515
Purchase Details
Closed on
Jul 1, 2002
Bought by
Baker Norma
Create a Home Valuation Report for This Property
The Home Valuation Report is an in-depth analysis detailing your home's value as well as a comparison with similar homes in the area
Home Values in the Area
Average Home Value in this Area
Purchase History
| Date | Buyer | Sale Price | Title Company |
|---|---|---|---|
| Foskuhl Richard | $183,408 | -- | |
| Baker Norma | $106,000 | -- |
Source: Public Records
Mortgage History
| Date | Status | Borrower | Loan Amount |
|---|---|---|---|
| Open | Foskuhl Richard | $146,647 |
Source: Public Records
Tax History Compared to Growth
Tax History
| Year | Tax Paid | Tax Assessment Tax Assessment Total Assessment is a certain percentage of the fair market value that is determined by local assessors to be the total taxable value of land and additions on the property. | Land | Improvement |
|---|---|---|---|---|
| 2025 | $4,250 | $27,888 | $2,222 | $25,666 |
| 2024 | $4,008 | $27,071 | $2,222 | $24,849 |
| 2023 | -- | $25,300 | $2,109 | $23,191 |
| 2022 | -- | $22,747 | $2,070 | $20,677 |
| 2021 | -- | $21,160 | $2,024 | $19,136 |
| 2020 | -- | -- | $1,978 | $17,940 |
| 2019 | -- | -- | $2,001 | $17,342 |
| 2018 | -- | -- | $1,748 | $16,767 |
| 2017 | -- | -- | $1,748 | $16,468 |
| 2016 | -- | -- | $1,610 | $15,445 |
| 2015 | -- | -- | $1,553 | $14,950 |
| 2014 | -- | -- | $1,645 | $15,318 |
Source: Public Records
Map
Nearby Homes