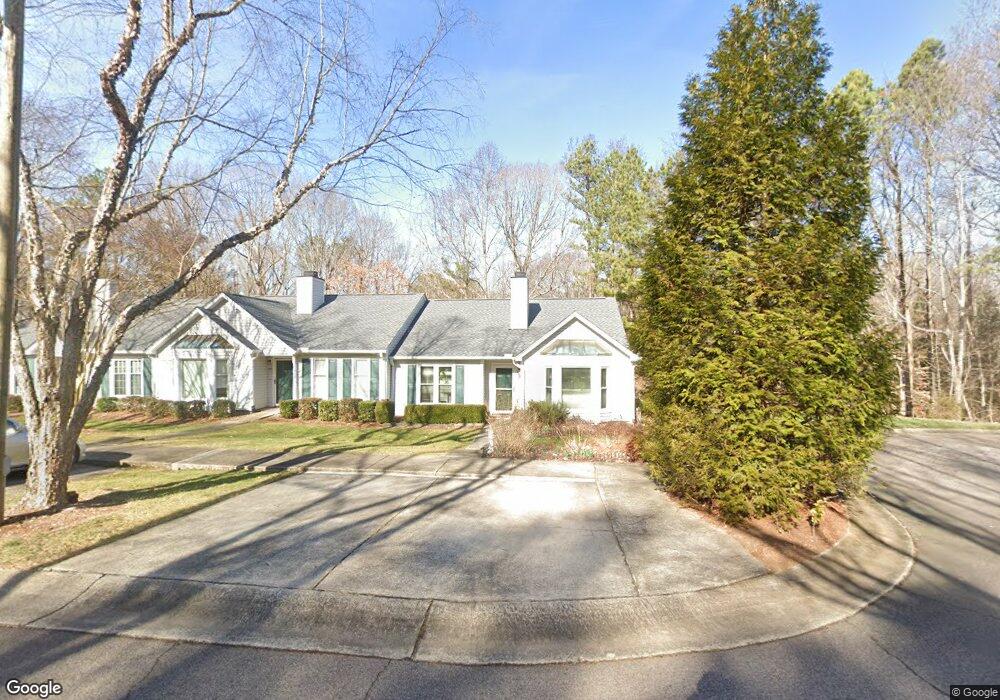
105 N Mclean Ct Cary, NC 27513
North Cary NeighborhoodEstimated Value: $257,000 - $300,000
2
Beds
2
Baths
1,248
Sq Ft
$227/Sq Ft
Est. Value
About This Home
This home is located at 105 N Mclean Ct, Cary, NC 27513 and is currently estimated at $283,039, approximately $226 per square foot. 105 N Mclean Ct is a home located in Wake County with nearby schools including Reedy Creek Elementary School, Reedy Creek Magnet Middle School, and Cary High School.
Ownership History
Date
Name
Owned For
Owner Type
Purchase Details
Closed on
Oct 31, 2022
Sold by
Murphy Catherine M
Bought by
Brewer Faraha
Current Estimated Value
Home Financials for this Owner
Home Financials are based on the most recent Mortgage that was taken out on this home.
Original Mortgage
$271,700
Outstanding Balance
$261,098
Interest Rate
6.02%
Mortgage Type
New Conventional
Estimated Equity
$21,941
Purchase Details
Closed on
May 29, 2012
Sold by
Lynch Don Andrew and Lynch Roseen Veronica
Bought by
Murphy Catherine M
Home Financials for this Owner
Home Financials are based on the most recent Mortgage that was taken out on this home.
Original Mortgage
$101,000
Interest Rate
3.9%
Mortgage Type
New Conventional
Purchase Details
Closed on
Oct 27, 2005
Sold by
Blaha Albert Lawrence
Bought by
Lynch Don Andrew and Lynch Roseen Veronica
Home Financials for this Owner
Home Financials are based on the most recent Mortgage that was taken out on this home.
Original Mortgage
$103,050
Interest Rate
4.75%
Mortgage Type
Fannie Mae Freddie Mac
Create a Home Valuation Report for This Property
The Home Valuation Report is an in-depth analysis detailing your home's value as well as a comparison with similar homes in the area
Home Values in the Area
Average Home Value in this Area
Purchase History
| Date | Buyer | Sale Price | Title Company |
|---|---|---|---|
| Brewer Faraha | $286,000 | -- | |
| Murphy Catherine M | $129,000 | None Available | |
| Lynch Don Andrew | $114,500 | None Available |
Source: Public Records
Mortgage History
| Date | Status | Borrower | Loan Amount |
|---|---|---|---|
| Open | Brewer Faraha | $271,700 | |
| Closed | Brewer Faraha | $8,000 | |
| Previous Owner | Murphy Catherine M | $101,000 | |
| Previous Owner | Lynch Don Andrew | $103,050 |
Source: Public Records
Tax History
| Year | Tax Paid | Tax Assessment Tax Assessment Total Assessment is a certain percentage of the fair market value that is determined by local assessors to be the total taxable value of land and additions on the property. | Land | Improvement |
|---|---|---|---|---|
| 2025 | $2,344 | $271,152 | $110,000 | $161,152 |
| 2024 | $2,294 | $271,152 | $110,000 | $161,152 |
Source: Public Records
Map
Nearby Homes
- 119 S Mclean Ct
- 1399 N Harrison Ave
- 917 Reedy Creek Rd
- 501 Gooseneck Dr Unit B2
- 102 Choptank Ct Unit B2
- 405 Gooseneck Dr Unit B2
- 101 Red Stone Ct
- 292 Beechtree Dr
- 109 Silverrock Ct
- 319 Silverberry Ct
- 316 Matilda Place
- 111 Killam Ct Unit LB
- 115 Abingdon Ct Unit 2b
- 508 Nantucket Dr
- 104 Bailey Park Ct
- 135 Boldleaf Ct
- 1133 Evans Rd
- 201 Windbyrne Dr
- 1025 Evans Rd
- 243 Windbyrne Dr
- 103 N Mclean Ct
- 101 N Mclean Ct
- 104 N Mclean Ct
- 106 N Mclean Ct
- 102 N Mclean Ct
- 108 N Mclean Ct
- 100 N Mclean Ct Unit 1
- 109 Westongate Way
- 110 N Mclean Ct
- 112 N Mclean Ct
- 114 N Mclean Ct
- 102 Mccartney Ct
- 104 Mccartney Ct
- 100 Mccartney Ct
- 107 Westongate Way
- 106 Mccartney Ct
- 101 S Mclean Ct
- 103 S Mclean Ct Unit 70
- 105 S Mclean Ct
- 107 S Mclean Ct
Your Personal Tour Guide
Ask me questions while you tour the home.