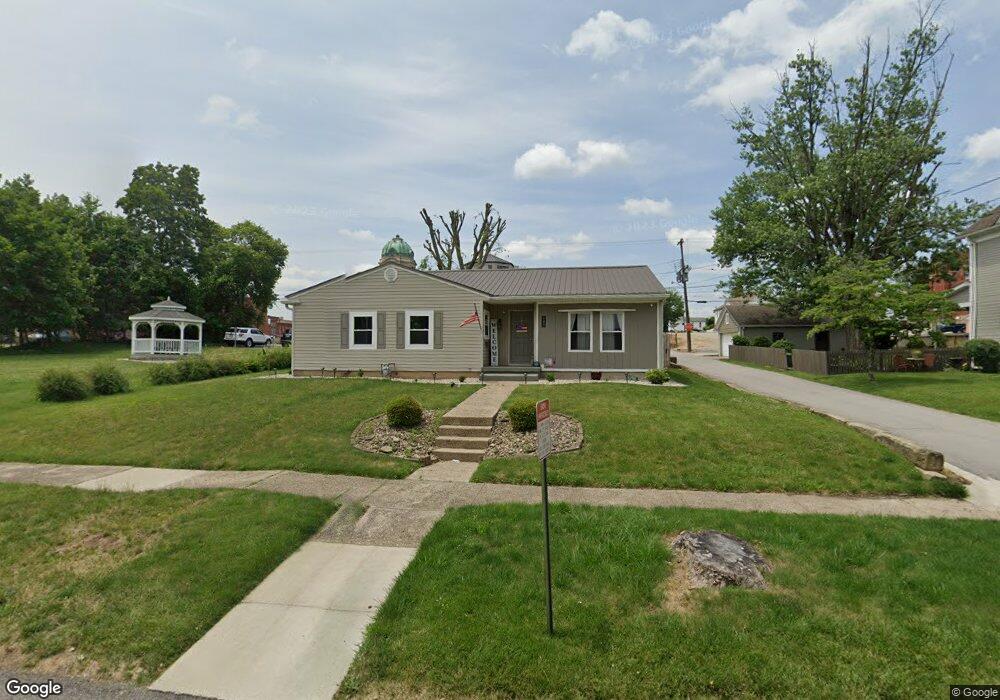
105 N Paul St Woodsfield, OH 43793
Estimated Value: $91,000 - $169,000
--
Bed
1
Bath
1,476
Sq Ft
$92/Sq Ft
Est. Value
About This Home
This home is located at 105 N Paul St, Woodsfield, OH 43793 and is currently estimated at $135,482, approximately $91 per square foot. 105 N Paul St is a home located in Monroe County with nearby schools including Woodsfield Elementary School, River Elementary School, and Monroe Central High School.
Ownership History
Date
Name
Owned For
Owner Type
Purchase Details
Closed on
Jun 30, 2020
Sold by
Schumacher Greg and Yoho Paris
Bought by
Mchugh Nicholas and Mchugh Maria
Current Estimated Value
Home Financials for this Owner
Home Financials are based on the most recent Mortgage that was taken out on this home.
Original Mortgage
$48,000
Outstanding Balance
$42,563
Interest Rate
3.1%
Mortgage Type
Unknown
Estimated Equity
$92,919
Purchase Details
Closed on
Sep 10, 2019
Sold by
Dietz Allison K
Bought by
Schumacher Greg and Yoho Paris
Home Financials for this Owner
Home Financials are based on the most recent Mortgage that was taken out on this home.
Original Mortgage
$45,000
Interest Rate
3.6%
Mortgage Type
Purchase Money Mortgage
Purchase Details
Closed on
Sep 20, 2011
Sold by
Turner Davey L and Turner Sandra K
Bought by
Turner-Schumacher Ashley and Dietz Allison K
Create a Home Valuation Report for This Property
The Home Valuation Report is an in-depth analysis detailing your home's value as well as a comparison with similar homes in the area
Home Values in the Area
Average Home Value in this Area
Purchase History
| Date | Buyer | Sale Price | Title Company |
|---|---|---|---|
| Mchugh Nicholas | $120,000 | None Available | |
| Schumacher Greg | $36,000 | None Available | |
| Turner-Schumacher Ashley | -- | -- |
Source: Public Records
Mortgage History
| Date | Status | Borrower | Loan Amount |
|---|---|---|---|
| Open | Mchugh Nicholas | $48,000 | |
| Previous Owner | Schumacher Greg | $45,000 |
Source: Public Records
Tax History Compared to Growth
Tax History
| Year | Tax Paid | Tax Assessment Tax Assessment Total Assessment is a certain percentage of the fair market value that is determined by local assessors to be the total taxable value of land and additions on the property. | Land | Improvement |
|---|---|---|---|---|
| 2024 | $1,002 | $31,830 | $5,130 | $26,700 |
| 2023 | $1,002 | $31,830 | $5,130 | $26,700 |
| 2022 | $906 | $31,830 | $5,130 | $26,700 |
| 2021 | $886 | $30,800 | $4,280 | $26,520 |
| 2020 | $910 | $30,800 | $4,280 | $26,520 |
| 2019 | $886 | $30,800 | $4,280 | $26,520 |
| 2018 | $858 | $28,820 | $3,560 | $25,260 |
| 2017 | $864 | $28,820 | $3,560 | $25,260 |
| 2016 | $877 | $28,820 | $3,560 | $25,260 |
| 2015 | $820 | $25,490 | $2,870 | $22,620 |
| 2014 | $820 | $25,490 | $2,870 | $22,620 |
| 2013 | $857 | $24,750 | $2,790 | $21,960 |
Source: Public Records
Map
Nearby Homes
- 108 S Paul St
- 108.5 S Paul Alley
- 210 E Church St
- 108 Oaklawn Ave
- 206 Ohio St
- 302 High St
- 303 High St
- 208 Center St
- 315 Eastern Ave
- 220 Oaklawn Ave
- 198 N Monroe St
- 407 High St
- 418 Eastern Ave
- 333 S Main St
- 167 Andover Rd
- 147 Andover Rd
- 0 Barber Ridge Rd
- 39709 State Route 255
- 49402 Patton Rd
- 42617 Ohio 800