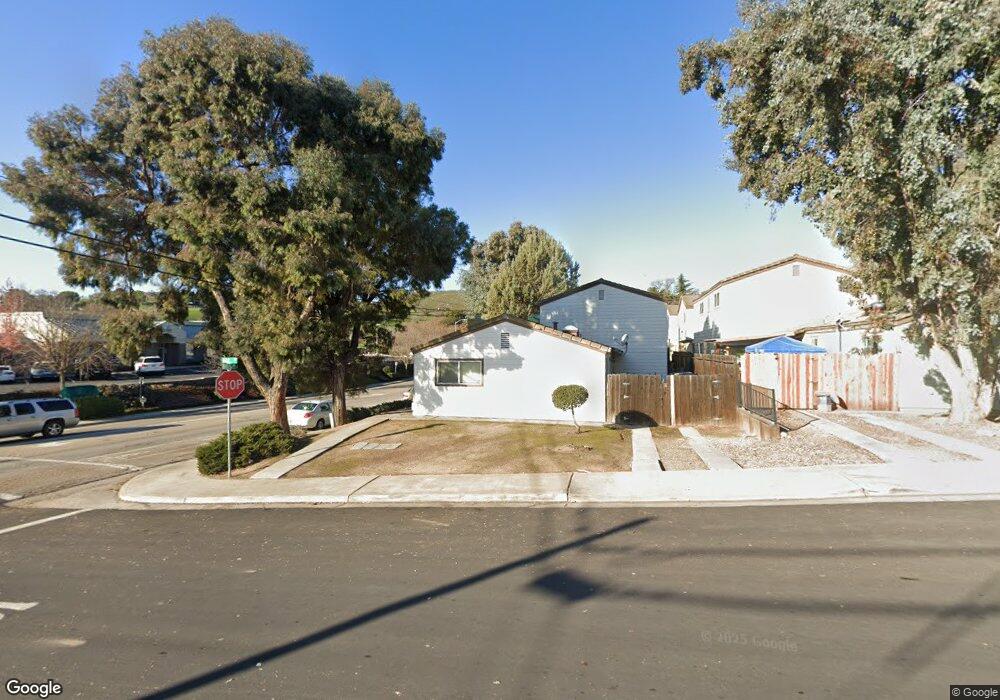
105 Oak St Paso Robles, CA 93446
Estimated Value: $666,000 - $1,544,000
6
Beds
3
Baths
2,844
Sq Ft
$365/Sq Ft
Est. Value
About This Home
This home is located at 105 Oak St, Paso Robles, CA 93446 and is currently estimated at $1,038,000, approximately $364 per square foot. 105 Oak St is a home located in San Luis Obispo County with nearby schools including Glen Speck Elementary School, George H. Flamson Middle School, and Paso Robles High School.
Ownership History
Date
Name
Owned For
Owner Type
Purchase Details
Closed on
Jun 12, 1998
Sold by
Brotemarkle Investment Company Inc
Bought by
Gallo John F and Gallo Janet L
Current Estimated Value
Purchase Details
Closed on
Aug 18, 1994
Sold by
Brotemarkle Madge
Bought by
Brotemarkle Investment Co
Purchase Details
Closed on
Sep 13, 1993
Sold by
Mountain States Mtg Centers Inc
Bought by
Hud
Create a Home Valuation Report for This Property
The Home Valuation Report is an in-depth analysis detailing your home's value as well as a comparison with similar homes in the area
Purchase History
| Date | Buyer | Sale Price | Title Company |
|---|---|---|---|
| Gallo John F | -- | -- | |
| Brotemarkle Investment Co | -- | -- | |
| Hud | -- | Ticor Title Insurance Compan |
Source: Public Records
Tax History
| Year | Tax Paid | Tax Assessment Tax Assessment Total Assessment is a certain percentage of the fair market value that is determined by local assessors to be the total taxable value of land and additions on the property. | Land | Improvement |
|---|---|---|---|---|
| 2025 | $2,567 | $235,487 | $79,822 | $155,665 |
| 2024 | $2,525 | $230,870 | $78,257 | $152,613 |
| 2023 | $2,525 | $226,344 | $76,723 | $149,621 |
| 2022 | $2,487 | $221,907 | $75,219 | $146,688 |
| 2021 | $2,445 | $217,557 | $73,745 | $143,812 |
| 2020 | $2,412 | $215,327 | $72,989 | $142,338 |
| 2019 | $2,377 | $211,106 | $71,558 | $139,548 |
| 2018 | $2,345 | $206,967 | $70,155 | $136,812 |
| 2017 | $2,205 | $202,910 | $68,780 | $134,130 |
| 2016 | $2,162 | $198,932 | $67,432 | $131,500 |
| 2015 | $2,154 | $195,945 | $66,420 | $129,525 |
| 2014 | $2,079 | $192,107 | $65,119 | $126,988 |
Source: Public Records
Map
Nearby Homes
Your Personal Tour Guide
Ask me questions while you tour the home.