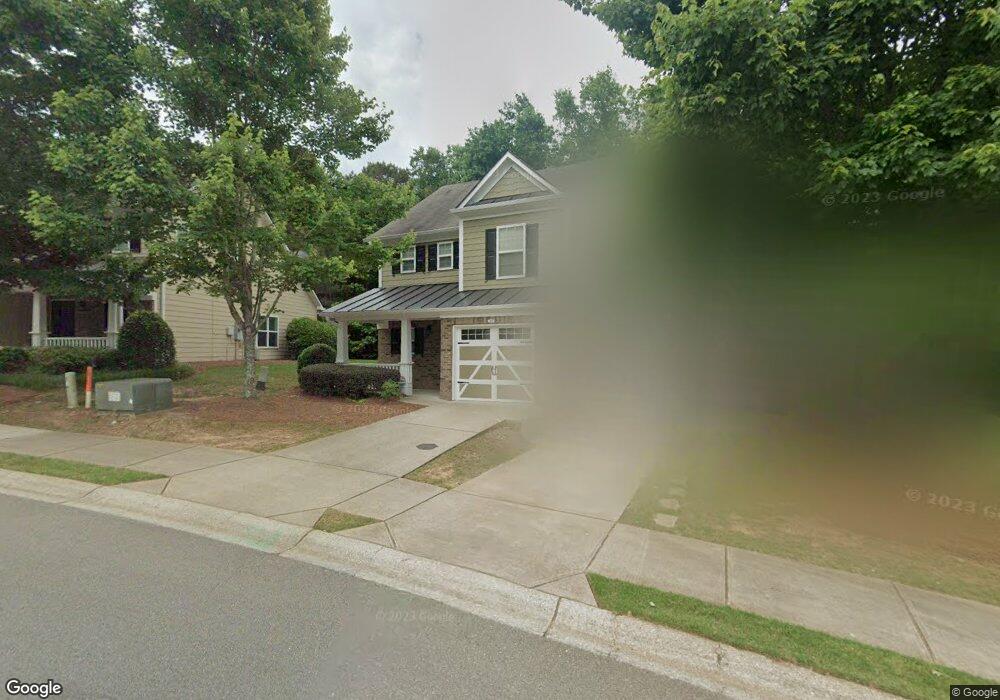
105 Oakview Passage Canton, GA 30114
Estimated Value: $294,205 - $323,000
2
Beds
3
Baths
1,370
Sq Ft
$225/Sq Ft
Est. Value
About This Home
This home is located at 105 Oakview Passage, Canton, GA 30114 and is currently estimated at $308,603, approximately $225 per square foot. 105 Oakview Passage is a home located in Cherokee County with nearby schools including J. Knox Elementary School, Teasley Middle School, and Cherokee High School.
Ownership History
Date
Name
Owned For
Owner Type
Purchase Details
Closed on
Mar 27, 2012
Sold by
Mcbride Son Homes Land D
Bought by
Msh Syndicated Holdings Llc and C/O Bank Of America Na
Current Estimated Value
Purchase Details
Closed on
Jan 28, 2011
Sold by
Chester Mary J
Bought by
Chester Mary J Trust
Home Financials for this Owner
Home Financials are based on the most recent Mortgage that was taken out on this home.
Original Mortgage
$88,500
Interest Rate
4.79%
Mortgage Type
New Conventional
Purchase Details
Closed on
Jun 26, 2009
Sold by
Mcbride & Son Hms Atlanta Llc
Bought by
Marino James R and Marino Doris H
Home Financials for this Owner
Home Financials are based on the most recent Mortgage that was taken out on this home.
Original Mortgage
$78,000
Interest Rate
4.79%
Mortgage Type
New Conventional
Create a Home Valuation Report for This Property
The Home Valuation Report is an in-depth analysis detailing your home's value as well as a comparison with similar homes in the area
Home Values in the Area
Average Home Value in this Area
Purchase History
| Date | Buyer | Sale Price | Title Company |
|---|---|---|---|
| Msh Syndicated Holdings Llc | -- | -- | |
| Chester Mary J Trust | -- | -- | |
| Chester Mary J | $118,500 | -- | |
| Marino James R | $128,500 | -- |
Source: Public Records
Mortgage History
| Date | Status | Borrower | Loan Amount |
|---|---|---|---|
| Previous Owner | Chester Mary J | $88,500 | |
| Previous Owner | Marino James R | $78,000 |
Source: Public Records
Tax History Compared to Growth
Tax History
| Year | Tax Paid | Tax Assessment Tax Assessment Total Assessment is a certain percentage of the fair market value that is determined by local assessors to be the total taxable value of land and additions on the property. | Land | Improvement |
|---|---|---|---|---|
| 2024 | $2,871 | $100,296 | $26,000 | $74,296 |
| 2023 | $2,805 | $97,996 | $26,000 | $71,996 |
| 2022 | $2,208 | $76,932 | $18,000 | $58,932 |
| 2021 | $1,954 | $64,068 | $18,000 | $46,068 |
| 2020 | $1,841 | $60,328 | $18,000 | $42,328 |
| 2019 | $1,674 | $54,800 | $16,400 | $38,400 |
| 2018 | $1,498 | $48,760 | $13,200 | $35,560 |
| 2017 | $1,469 | $118,800 | $13,200 | $34,320 |
| 2016 | $1,095 | $106,400 | $10,800 | $31,760 |
| 2015 | $1,053 | $101,400 | $9,600 | $30,960 |
| 2014 | $1,186 | $92,000 | $9,600 | $27,200 |
Source: Public Records
Map
Nearby Homes
- 233 Oakview Dr
- 210 Oakview Dr
- The Deerfield Plan at River Green - The Village
- The Greenfield Plan at River Green - The Village
- 221 Village Overlook Unit H2
- 318 Rampart St
- 316 Rampart St
- 314 Rampart St
- 312 Rampart St
- 100 Academy Ln
- 315 N Rampart St
- 203 Retreat Ln
- 201 Retreat Ln
- 233 Retreat Ln
- 421 Retreat Ln
- 425 Retreat Ln Unit K1
- 425 Retreat Ln
- 117 Market Ln
- 427 Retreat Ln
- 324 Willow Walk
- 103 Oakview Passage
- 107 Oakview Passage
- 107 Oakview Passage Unit 86
- 107 Oakview Passage Unit 107
- 109 Oakview Passage Unit 85
- 109 Oakview Passage
- 101 Oakview Passage
- 101 Oakview Passage
- 111 Oakview Passage Unit 84
- 111 Oakview Passage
- 264 Oakview Dr
- 113 Oakview Passage Unit 83
- 113 Oakview Passage
- 113 Oakview Passage Unit 2/83
- 102 Oakview Passage Unit 2
- 102 Oakview Passage Unit 102
- 102 Oakview Passage
- 104 Oakview Passage
- 104 Oakview Passage Unit 104
- 115 Oakview Passage Unit 82