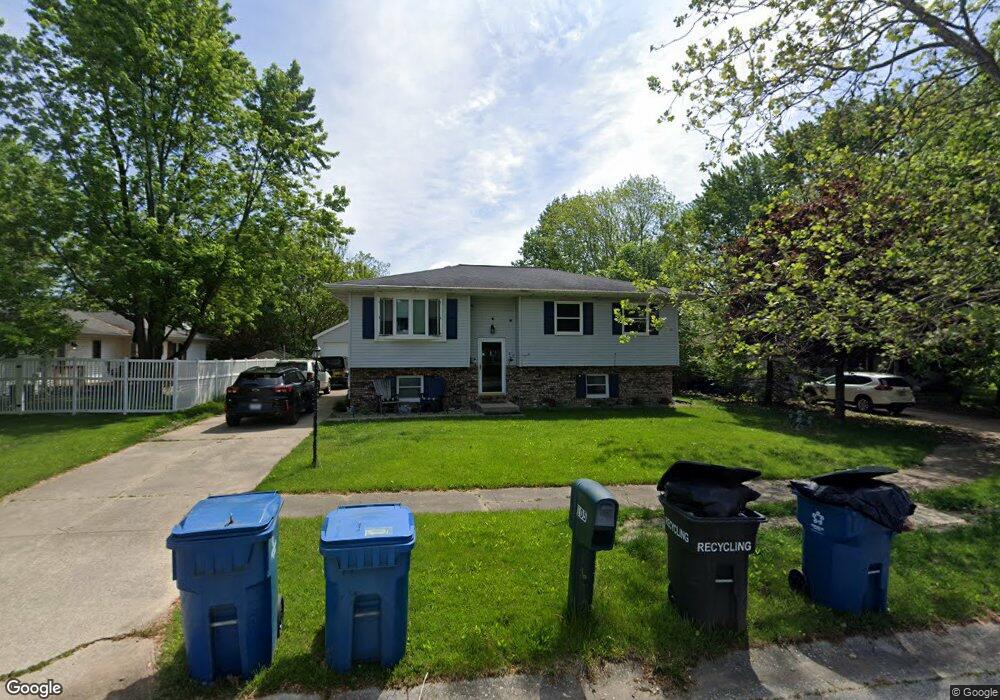
105 Pear Ct Hebron, IN 46341
Porter County NeighborhoodEstimated Value: $272,000 - $301,000
6
Beds
3
Baths
2,148
Sq Ft
$135/Sq Ft
Est. Value
About This Home
This home is located at 105 Pear Ct, Hebron, IN 46341 and is currently estimated at $289,005, approximately $134 per square foot. 105 Pear Ct is a home located in Porter County with nearby schools including Hebron Elementary School, Hebron Middle School, and Hebron High School.
Ownership History
Date
Name
Owned For
Owner Type
Purchase Details
Closed on
Sep 28, 2010
Sold by
Mcnelley Jeff
Bought by
Zaragoza Susan F
Current Estimated Value
Home Financials for this Owner
Home Financials are based on the most recent Mortgage that was taken out on this home.
Original Mortgage
$155,440
Outstanding Balance
$100,193
Interest Rate
4.36%
Mortgage Type
New Conventional
Estimated Equity
$188,812
Purchase Details
Closed on
Jun 4, 2010
Sold by
Whttp Llc
Bought by
Mcnelley Jeff
Purchase Details
Closed on
May 28, 2010
Sold by
Secretary Of Housing & Urban Development
Bought by
Whttp Llc
Purchase Details
Closed on
Mar 24, 2009
Sold by
Phh Mortgage Corporation
Bought by
Secretary Of Housing & Urban Development
Purchase Details
Closed on
Mar 11, 2009
Sold by
Robinson James C and Regional Federal Credit Union
Bought by
Phh Mortgage Corporation
Create a Home Valuation Report for This Property
The Home Valuation Report is an in-depth analysis detailing your home's value as well as a comparison with similar homes in the area
Home Values in the Area
Average Home Value in this Area
Purchase History
| Date | Buyer | Sale Price | Title Company |
|---|---|---|---|
| Zaragoza Susan F | -- | Meridian Title Corp | |
| Mcnelley Jeff | -- | Accommodation | |
| Whttp Llc | -- | Meridian Title Corp | |
| Secretary Of Housing & Urban Development | -- | None Available | |
| Phh Mortgage Corporation | $137,163 | None Available |
Source: Public Records
Mortgage History
| Date | Status | Borrower | Loan Amount |
|---|---|---|---|
| Open | Zaragoza Susan F | $155,440 |
Source: Public Records
Tax History
| Year | Tax Paid | Tax Assessment Tax Assessment Total Assessment is a certain percentage of the fair market value that is determined by local assessors to be the total taxable value of land and additions on the property. | Land | Improvement |
|---|---|---|---|---|
| 2025 | $2,775 | $260,900 | $31,700 | $229,200 |
| 2024 | $2,705 | $249,000 | $29,500 | $219,500 |
| 2023 | $2,501 | $239,500 | $27,800 | $211,700 |
| 2022 | $2,474 | $225,800 | $27,800 | $198,000 |
| 2021 | $2,144 | $191,600 | $27,800 | $163,800 |
| 2020 | $1,998 | $178,700 | $25,300 | $153,400 |
| 2019 | $1,916 | $171,700 | $25,300 | $146,400 |
| 2018 | $1,943 | $165,100 | $25,300 | $139,800 |
| 2017 | $1,865 | $157,800 | $25,300 | $132,500 |
| 2016 | $1,936 | $163,900 | $24,600 | $139,300 |
| 2014 | $2,011 | $169,200 | $24,800 | $144,400 |
| 2013 | -- | $151,800 | $24,900 | $126,900 |
Source: Public Records
Map
Nearby Homes
Your Personal Tour Guide
Ask me questions while you tour the home.