105 Pine St Unit Tamarack Herlong, CA 96113
Estimated Value: $75,000 - $105,000
3
Beds
1
Bath
913
Sq Ft
$98/Sq Ft
Est. Value
About This Home
This home is located at 105 Pine St Unit Tamarack, Herlong, CA 96113 and is currently estimated at $89,895, approximately $98 per square foot. 105 Pine St Unit Tamarack is a home located in Lassen County with nearby schools including Sierra Primary School, Fort Sage Middle School, and Herlong High School.
Ownership History
Date
Name
Owned For
Owner Type
Purchase Details
Closed on
Sep 27, 2019
Sold by
2019 Castle Llc
Bought by
Crockett Jae S
Current Estimated Value
Purchase Details
Closed on
Jul 8, 2019
Sold by
Great American Life Insurance Company
Bought by
Castle Llc
Purchase Details
Closed on
Mar 5, 2019
Sold by
Treder Barrett Daffin Frappier and Treder Weiss L
Bought by
Great American Life Insurance
Purchase Details
Closed on
Feb 21, 2019
Sold by
Treder Barrett Daffin Frappier and Treder Weiss L
Bought by
Great American Life Insurance
Purchase Details
Closed on
Jul 21, 2016
Sold by
Scott Rebecca J
Bought by
Scott Robert O
Create a Home Valuation Report for This Property
The Home Valuation Report is an in-depth analysis detailing your home's value as well as a comparison with similar homes in the area
Purchase History
We collect this data history from publicly available records. To have your information removed, we recommend requesting removal directly through your county’s website.
| Date | Buyer | Sale Price | Title Company |
|---|---|---|---|
| Crockett Jae S | $20,000 | Cal Sterra Title Co | |
| Castle Llc | $5,050 | None Available | |
| Great American Life Insurance | $30,000 | None Listed On Document | |
| Great American Life Insurance | $30,000 | None Listed On Document | |
| Scott Robert O | -- | None Available |
Source: Public Records
Tax History
| Year | Tax Paid | Tax Assessment Tax Assessment Total Assessment is a certain percentage of the fair market value that is determined by local assessors to be the total taxable value of land and additions on the property. | Land | Improvement |
|---|---|---|---|---|
| 2025 | $454 | $43,742 | $10,935 | $32,807 |
| 2024 | $454 | $42,885 | $10,721 | $32,164 |
| 2023 | $445 | $42,045 | $10,511 | $31,534 |
| 2022 | $437 | $41,221 | $10,305 | $30,916 |
| 2021 | $429 | $40,413 | $10,103 | $30,310 |
| 2020 | $425 | $40,000 | $10,000 | $30,000 |
| 2019 | $625 | $60,000 | $10,000 | $50,000 |
| 2018 | $608 | $45,000 | $10,000 | $35,000 |
| 2017 | $583 | $45,000 | $10,000 | $35,000 |
| 2016 | $466 | $32,500 | $7,500 | $25,000 |
| 2015 | $1,267 | $23,000 | $6,000 | $17,000 |
| 2014 | $1,263 | $23,000 | $6,000 | $17,000 |
Source: Public Records
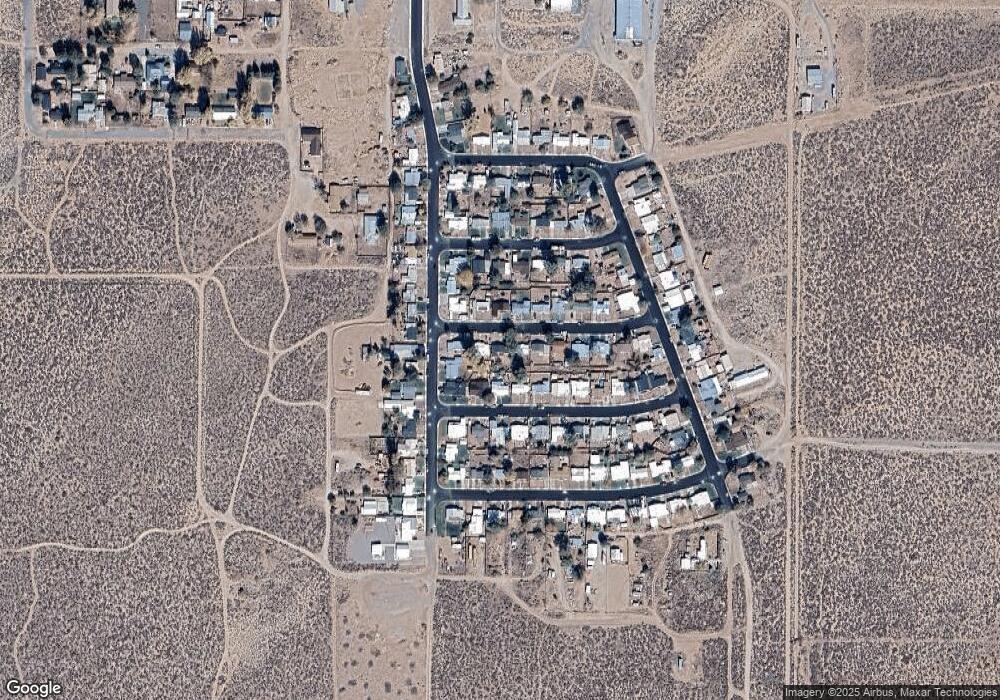
Map
Nearby Homes
- 129 Spruce St
- 110 Tamarack St
- 137-100-063 Herlong Access Rd
- 740-990 Arroyo Dr
- 447-040 Garnier Rd
- 447-255 Nevada
- 448-050 Mirage Ln
- 0 Fairview Dr
- 741500 Jasmine Ln
- 448-450 Mirage Ln
- 446-540 Pioneer Ln
- 0 Hackstaff Rd
- 446-525 Honey Lake Rd
- 139-340-010 Garnier Rd
- 737 Herlong Access Rd
- 737-455 Herlong Access Rd
- 000 Winters Rd
- 742-135 Cowboy Joe
- 0 Cowboy Joe Rd
- 437-150 US Highway 395
Your Personal Tour Guide
Ask me questions while you tour the home.