Estimated Value: $278,835 - $296,000
3
Beds
2
Baths
1,689
Sq Ft
$170/Sq Ft
Est. Value
About This Home
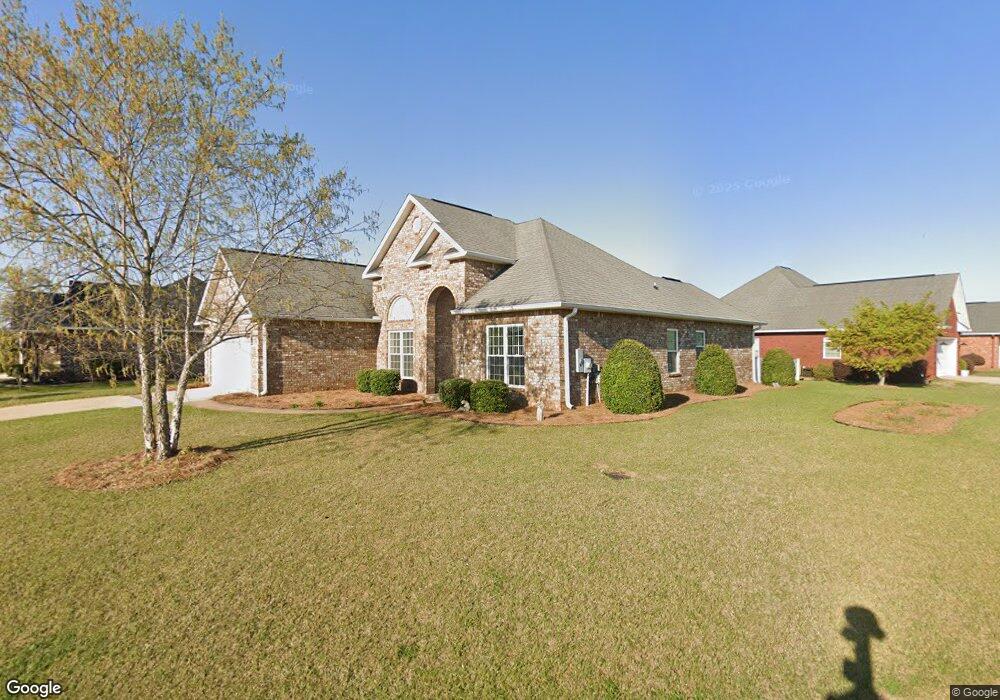
This home is located at 105 Rambling Creek Cove Unit 22 C, Byron, GA 31008 and is currently estimated at $287,459, approximately $170 per square foot. 105 Rambling Creek Cove Unit 22 C is a home located in Peach County with nearby schools including Byron Elementary School, Byron Middle School, and Peach County High School.
Ownership History
Date
Name
Owned For
Owner Type
Purchase Details
Closed on
Aug 15, 2025
Sold by
Jones Veronica G
Bought by
Hatcher Donna and Hatcher Michael
Current Estimated Value
Home Financials for this Owner
Home Financials are based on the most recent Mortgage that was taken out on this home.
Original Mortgage
$202,300
Outstanding Balance
$202,125
Interest Rate
6.74%
Mortgage Type
VA
Estimated Equity
$85,334
Purchase Details
Closed on
Dec 1, 2012
Sold by
Lommatzsch Martha L
Bought by
Jones Veronica G
Purchase Details
Closed on
Mar 28, 2012
Sold by
Lommatzsch Martha L
Bought by
Lommatzsch Martha L As Trustee
Purchase Details
Closed on
Sep 17, 2010
Sold by
Mccurdy Dawn M
Bought by
Lommatzsch Martha L
Home Financials for this Owner
Home Financials are based on the most recent Mortgage that was taken out on this home.
Original Mortgage
$136,000
Interest Rate
4.44%
Mortgage Type
New Conventional
Purchase Details
Closed on
Aug 3, 2009
Sold by
Primo Homes Inc
Bought by
Lommatzsch Martha L and Mccurdy Dawn M
Home Financials for this Owner
Home Financials are based on the most recent Mortgage that was taken out on this home.
Original Mortgage
$171,013
Interest Rate
5.26%
Mortgage Type
FHA
Purchase Details
Closed on
Jun 17, 2005
Sold by
Dover Barbara Jordan
Bought by
Primo Homes Inc
Create a Home Valuation Report for This Property
The Home Valuation Report is an in-depth analysis detailing your home's value as well as a comparison with similar homes in the area
Home Values in the Area
Average Home Value in this Area
Purchase History
| Date | Buyer | Sale Price | Title Company |
|---|---|---|---|
| Hatcher Donna | $289,000 | -- | |
| Jones Veronica G | $225,000 | -- | |
| Lommatzsch Martha L As Trustee | -- | -- | |
| Lommatzsch Martha L | -- | -- | |
| Lommatzsch Martha L | $174,168 | -- | |
| Primo Homes Inc | -- | -- |
Source: Public Records
Mortgage History
| Date | Status | Borrower | Loan Amount |
|---|---|---|---|
| Open | Hatcher Donna | $202,300 | |
| Previous Owner | Lommatzsch Martha L | $136,000 | |
| Previous Owner | Lommatzsch Martha L | $171,013 |
Source: Public Records
Tax History Compared to Growth
Tax History
| Year | Tax Paid | Tax Assessment Tax Assessment Total Assessment is a certain percentage of the fair market value that is determined by local assessors to be the total taxable value of land and additions on the property. | Land | Improvement |
|---|---|---|---|---|
| 2024 | $3,664 | $107,800 | $14,400 | $93,400 |
| 2023 | $2,115 | $103,600 | $12,800 | $90,800 |
| 2022 | $2,253 | $92,000 | $12,800 | $79,200 |
| 2021 | $1,585 | $68,760 | $12,800 | $55,960 |
| 2020 | $1,652 | $70,920 | $12,800 | $58,120 |
| 2019 | $1,607 | $69,240 | $12,800 | $56,440 |
| 2018 | $1,616 | $69,240 | $12,800 | $56,440 |
| 2017 | $1,623 | $69,240 | $12,800 | $56,440 |
| 2016 | $1,466 | $64,480 | $10,400 | $54,080 |
| 2015 | $1,466 | $64,480 | $10,400 | $54,080 |
| 2014 | $1,466 | $64,480 | $10,400 | $54,080 |
| 2013 | -- | $64,480 | $10,400 | $54,080 |
Source: Public Records
Map
Nearby Homes
- 109 Rambling Creek Cove
- 302 Lamplight Dr
- The Coleman Plan at Cobblestone Crossing Commons
- The Phoenix Plan at Cobblestone Crossing Commons
- The Crawford Plan at Cobblestone Crossing Commons
- The Piedmont Plan at Cobblestone Crossing Commons
- The Bradley Plan at Cobblestone Crossing Commons
- The Caldwell Plan at Cobblestone Crossing Commons
- The McGinnis Plan at Cobblestone Crossing Commons
- 412 Lamplight Dr
- 106 Coventry Manor Ct
- 100 Coventry Manor Ct
- 206 Amber Dr
- 302 Beau Claire Cir
- 312 Beau Claire Cir
- 310 Beau Claire Cir
- 240 Beau Claire Cir
- 238 Beau Claire Cir
- 0 Gunn Rd Unit 10620588
- 125 Amber Dr
- 105 Rambling Creek Cove
- 103 Rambling Creek Cove
- 107 Rambling Creek Cove
- 101 Rambling Creek Cove
- 301 Stonebrook Cir
- 108 Rambling Creek Cove Unit 28 B
- 110 Rambling Creek Cove
- 110 Rambling Creek Cove Unit 27 B
- 104 Rambling Creek Cove Unit 30 B
- 102 Rambling Creek Cove
- 102 Rambling Creek Cove Unit 31 B
- 213 Stonebrook Cir
- 106 Rambling Creek Cove Unit 29 B
- 401 Stonebrook Cir
- 99 Rambling Creek Cove
- 100 Rambling Creek Cove
- 211 Stonebrook Cir
- 101 Stonebrook Cir
- 4 Stonebrook Cir
- 403 Stonebrook Cir