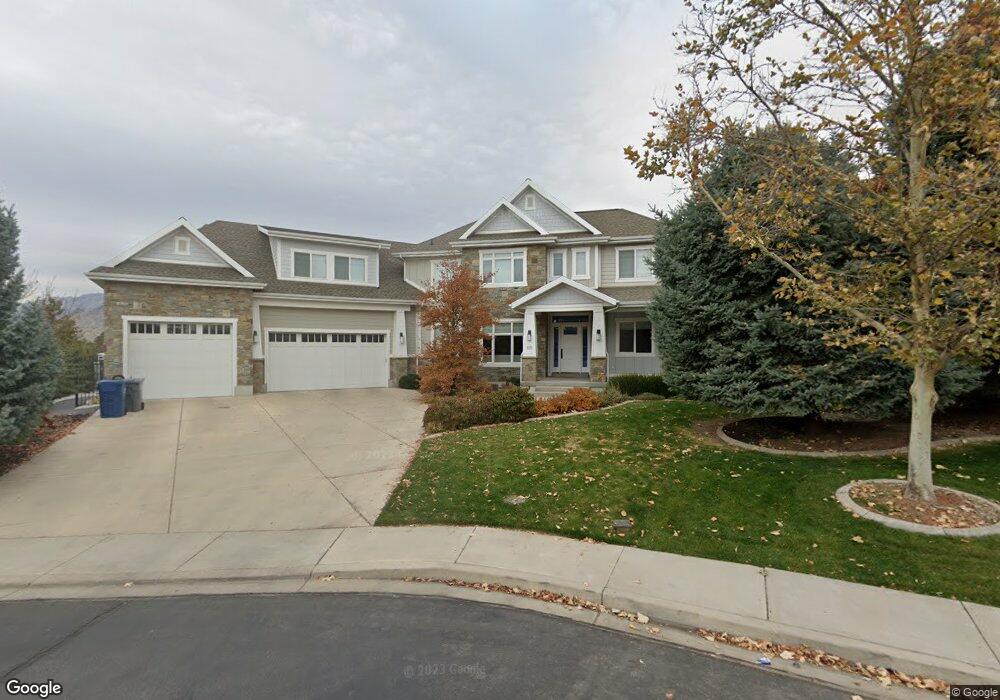
105 S 140 W Unit 11 Lindon, UT 84042
Estimated Value: $1,140,000 - $1,649,016
4
Beds
6
Baths
4,441
Sq Ft
$327/Sq Ft
Est. Value
About This Home
This home is located at 105 S 140 W Unit 11, Lindon, UT 84042 and is currently estimated at $1,453,254, approximately $327 per square foot. 105 S 140 W Unit 11 is a home located in Utah County with nearby schools including Aspen Elementary School, Oak Canyon Junior High School, and Pleasant Grove High School.
Ownership History
Date
Name
Owned For
Owner Type
Purchase Details
Closed on
Feb 3, 2017
Sold by
Ackley Jeremy and Ackley Rebecca A
Bought by
Ackley Jeremy and Ackley Rebecca A
Current Estimated Value
Purchase Details
Closed on
Jun 18, 2012
Sold by
Ackley Jeremy
Bought by
Ackley Jeremy and Ackley Rebecca A
Home Financials for this Owner
Home Financials are based on the most recent Mortgage that was taken out on this home.
Original Mortgage
$417,000
Outstanding Balance
$288,453
Interest Rate
3.79%
Mortgage Type
New Conventional
Estimated Equity
$1,164,801
Purchase Details
Closed on
Oct 5, 2011
Sold by
Constructions Millhaven
Bought by
Ackley Jeremy
Purchase Details
Closed on
Jun 1, 2011
Sold by
Washington Trust Bank
Bought by
Constructions Millhaven
Create a Home Valuation Report for This Property
The Home Valuation Report is an in-depth analysis detailing your home's value as well as a comparison with similar homes in the area
Home Values in the Area
Average Home Value in this Area
Purchase History
| Date | Buyer | Sale Price | Title Company |
|---|---|---|---|
| Ackley Jeremy | -- | Union Title | |
| Ackley Jeremy | -- | Union Title | |
| Ackley Jeremy | -- | Accommodation | |
| Constructions Millhaven | -- | Us Title Insurance Agency |
Source: Public Records
Mortgage History
| Date | Status | Borrower | Loan Amount |
|---|---|---|---|
| Open | Ackley Jeremy | $417,000 |
Source: Public Records
Tax History Compared to Growth
Tax History
| Year | Tax Paid | Tax Assessment Tax Assessment Total Assessment is a certain percentage of the fair market value that is determined by local assessors to be the total taxable value of land and additions on the property. | Land | Improvement |
|---|---|---|---|---|
| 2025 | $5,762 | $1,415,500 | $435,300 | $980,200 |
| 2024 | $5,762 | $710,270 | $0 | $0 |
| 2023 | $5,396 | $714,560 | $0 | $0 |
| 2022 | $5,202 | $665,335 | $0 | $0 |
| 2021 | $4,611 | $889,300 | $260,000 | $629,300 |
| 2020 | $4,328 | $821,800 | $216,700 | $605,100 |
| 2019 | $3,715 | $735,900 | $216,700 | $519,200 |
| 2018 | $3,586 | $669,700 | $186,300 | $483,400 |
| 2017 | $3,655 | $365,970 | $0 | $0 |
| 2016 | $3,754 | $347,710 | $0 | $0 |
| 2015 | $3,841 | $336,270 | $0 | $0 |
| 2014 | $3,332 | $288,970 | $0 | $0 |
Source: Public Records
Map
Nearby Homes