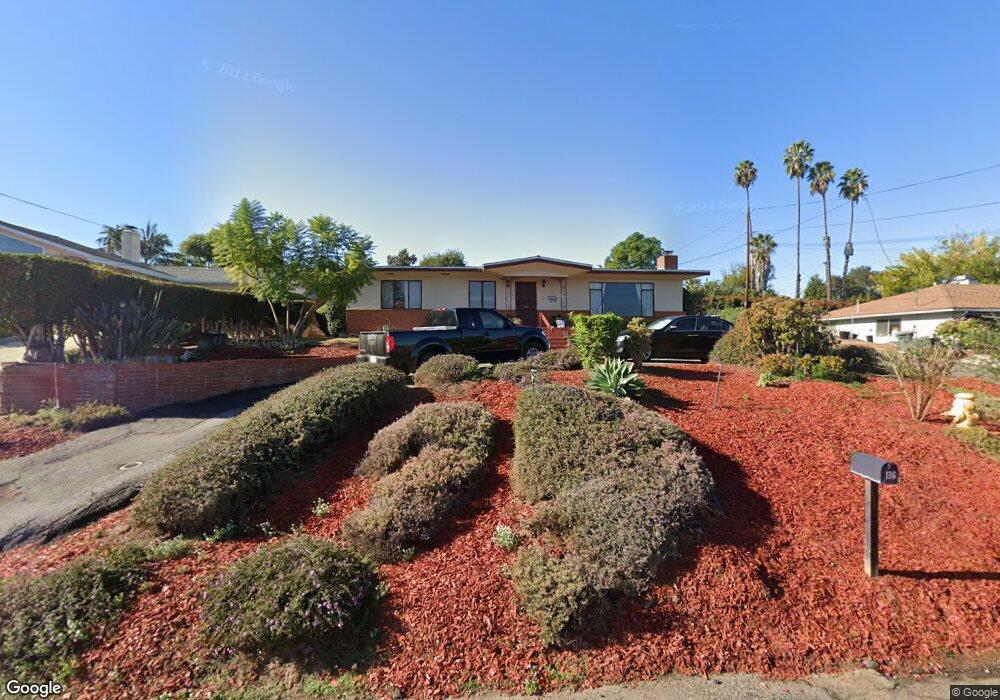
105 S Upas St Escondido, CA 92025
Central Escondido NeighborhoodEstimated Value: $681,085 - $778,000
2
Beds
2
Baths
1,356
Sq Ft
$544/Sq Ft
Est. Value
About This Home
This home is located at 105 S Upas St, Escondido, CA 92025 and is currently estimated at $738,021, approximately $544 per square foot. 105 S Upas St is a home located in San Diego County with nearby schools including Felicita Elementary, Del Dios Academy of Arts & Sciences, and San Pasqual High School.
Ownership History
Date
Name
Owned For
Owner Type
Purchase Details
Closed on
Sep 12, 2013
Sold by
Brown Wayne E and Brown Amy Whitby
Bought by
Brown Wayne E and Brown Amy Whitby
Current Estimated Value
Home Financials for this Owner
Home Financials are based on the most recent Mortgage that was taken out on this home.
Original Mortgage
$129,000
Outstanding Balance
$96,111
Interest Rate
4.36%
Mortgage Type
New Conventional
Estimated Equity
$641,910
Purchase Details
Closed on
Jul 26, 2012
Sold by
Brown Amy W and Brown Wayne
Bought by
Brown Wayne E and Brown Amy Whitby
Purchase Details
Closed on
Aug 8, 2004
Sold by
Brown Wayne E
Bought by
Brown Amy W and Brown Wayne
Purchase Details
Closed on
Jun 7, 2001
Sold by
Brown Wayne E and Brown Mary Louise Donovan
Bought by
Brown Wayne E
Home Financials for this Owner
Home Financials are based on the most recent Mortgage that was taken out on this home.
Original Mortgage
$160,000
Interest Rate
7.14%
Purchase Details
Closed on
Apr 16, 1993
Create a Home Valuation Report for This Property
The Home Valuation Report is an in-depth analysis detailing your home's value as well as a comparison with similar homes in the area
Home Values in the Area
Average Home Value in this Area
Purchase History
| Date | Buyer | Sale Price | Title Company |
|---|---|---|---|
| Brown Wayne E | -- | Artista National Title | |
| Brown Wayne E | -- | None Available | |
| Brown Amy W | -- | -- | |
| Brown Wayne E | -- | South Coast Title | |
| -- | $128,000 | -- |
Source: Public Records
Mortgage History
| Date | Status | Borrower | Loan Amount |
|---|---|---|---|
| Open | Brown Wayne E | $129,000 | |
| Closed | Brown Wayne E | $160,000 | |
| Closed | Brown Wayne E | $30,000 |
Source: Public Records
Tax History Compared to Growth
Tax History
| Year | Tax Paid | Tax Assessment Tax Assessment Total Assessment is a certain percentage of the fair market value that is determined by local assessors to be the total taxable value of land and additions on the property. | Land | Improvement |
|---|---|---|---|---|
| 2025 | $2,433 | $221,872 | $84,929 | $136,943 |
| 2024 | $2,433 | $217,522 | $83,264 | $134,258 |
| 2023 | $2,376 | $213,258 | $81,632 | $131,626 |
| 2022 | $2,349 | $209,078 | $80,032 | $129,046 |
| 2021 | $2,310 | $204,979 | $78,463 | $126,516 |
| 2020 | $2,296 | $202,878 | $77,659 | $125,219 |
| 2019 | $2,239 | $198,901 | $76,137 | $122,764 |
| 2018 | $2,176 | $195,002 | $74,645 | $120,357 |
| 2017 | $2,139 | $191,180 | $73,182 | $117,998 |
| 2016 | $2,096 | $187,433 | $71,748 | $115,685 |
| 2015 | $2,077 | $184,619 | $70,671 | $113,948 |
| 2014 | $1,991 | $181,003 | $69,287 | $111,716 |
Source: Public Records
Map
Nearby Homes
- 934 W 4th Ave
- 308 S Tulip St
- 1049 W 5th Ave
- 509 W 2nd Ave
- 215 Antoni Glen Unit 1112
- 225 Royal Glen Unit 408
- 752 W 9th Ave
- 1001 Ontario St
- 335 W 3rd Ave
- 1575 W Valley Pkwy Unit 25
- 1369 W 11th Ave
- 521 W 10th Ave
- 1756 Alhudson Dr
- 159 W 5th Ave
- 127 W 5th Ave
- 0 Via Ambiente Unit 170043393
- 0 Avenida Apice Unit NDP2508857
- 1001 S Hale Ave Unit 13
- 1110 Gaucho Place
- 955 Howard Ave Unit 40
- 127 S Upas St
- 1010 Murray Ct
- 121 Murray Ct
- 141 S Upas St
- 111 Murray Ct
- 107 Murray Ct
- 116 S Upas St
- 101 N Upas St
- 134 Howell Heights Dr
- 104 Caroline Way
- 102 Caroline Way
- 151 S Upas St
- 108 N Upas St
- 111 N Upas St
- 106 Caroline Way
- 110 Caroline Way
- 150 S Upas St
- 142 Howell Heights Dr
- 161 S Upas St
- 104 N Upas St