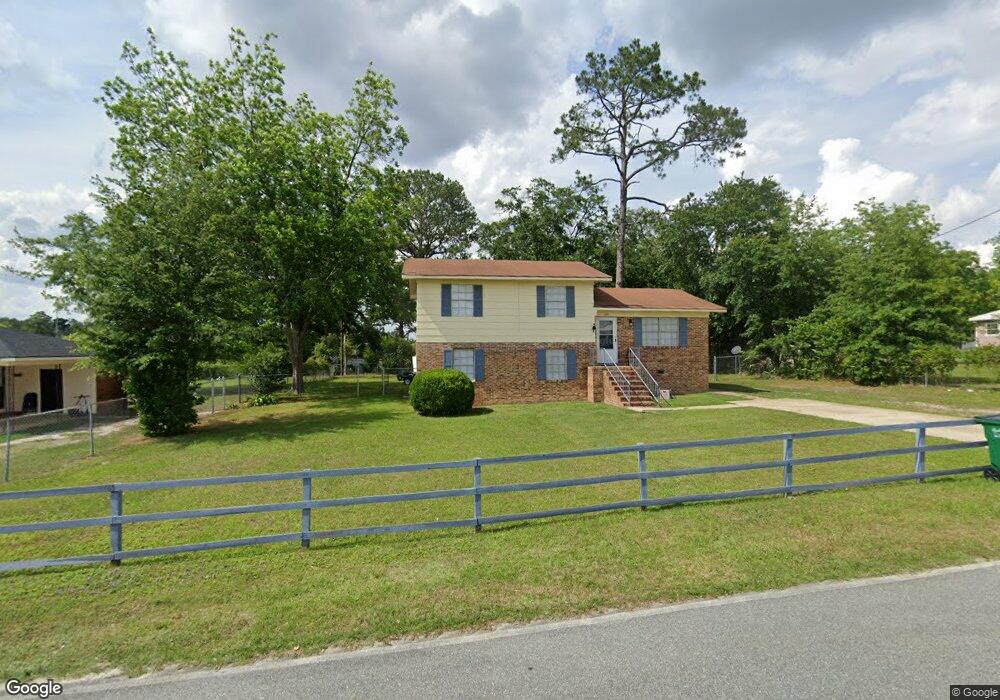
105 Thompson St Sylvester, GA 31791
Estimated Value: $135,000 - $178,000
3
Beds
2
Baths
1,717
Sq Ft
$92/Sq Ft
Est. Value
About This Home
This home is located at 105 Thompson St, Sylvester, GA 31791 and is currently estimated at $157,280, approximately $91 per square foot. 105 Thompson St is a home with nearby schools including Worth County Primary School, Worth County Elementary School, and Worth County Middle School.
Ownership History
Date
Name
Owned For
Owner Type
Purchase Details
Closed on
Jul 15, 2021
Sold by
Rbj Investments Llc
Bought by
Shiver Bob and Shiver Angel
Current Estimated Value
Purchase Details
Closed on
Sep 20, 2019
Sold by
Mckenzie Jerry Wayne
Bought by
Rbj Investments Llc
Purchase Details
Closed on
May 7, 2019
Sold by
Cordova Abby Victoria
Bought by
Mckenzie Jerry Wayne
Purchase Details
Closed on
Mar 19, 2018
Sold by
Cordova Abby Victoria
Bought by
Arellano Jerusalem
Purchase Details
Closed on
Oct 13, 2017
Sold by
Mckenzie Jerry Wayne
Bought by
Cordova Abby Victoria
Home Financials for this Owner
Home Financials are based on the most recent Mortgage that was taken out on this home.
Original Mortgage
$37,000
Interest Rate
3.78%
Mortgage Type
New Conventional
Purchase Details
Closed on
Oct 22, 2015
Sold by
Mckenzie Jerry Washington
Bought by
Mckenzie Jerry Wayne
Purchase Details
Closed on
Jan 10, 1986
Bought by
Mckenzie Jerry W
Create a Home Valuation Report for This Property
The Home Valuation Report is an in-depth analysis detailing your home's value as well as a comparison with similar homes in the area
Home Values in the Area
Average Home Value in this Area
Purchase History
| Date | Buyer | Sale Price | Title Company |
|---|---|---|---|
| Shiver Bob | $100,000 | -- | |
| Rbj Investments Llc | $25,000 | -- | |
| Mckenzie Jerry Wayne | -- | -- | |
| Arellano Jerusalem | -- | -- | |
| Cordova Abby Victoria | $40,000 | -- | |
| Mckenzie Jerry Wayne | -- | -- | |
| Mckenzie Jerry W | -- | -- |
Source: Public Records
Mortgage History
| Date | Status | Borrower | Loan Amount |
|---|---|---|---|
| Previous Owner | Cordova Abby Victoria | $37,000 |
Source: Public Records
Tax History
| Year | Tax Paid | Tax Assessment Tax Assessment Total Assessment is a certain percentage of the fair market value that is determined by local assessors to be the total taxable value of land and additions on the property. | Land | Improvement |
|---|---|---|---|---|
| 2025 | $1,386 | $50,542 | $3,900 | $46,642 |
| 2024 | $1,066 | $28,857 | $4,325 | $24,532 |
| 2023 | $1,066 | $28,857 | $4,325 | $24,532 |
| 2022 | $1,038 | $28,857 | $4,325 | $24,532 |
| 2021 | $1,036 | $28,857 | $4,325 | $24,532 |
| 2020 | $360 | $28,857 | $4,325 | $24,532 |
| 2019 | $1,036 | $28,857 | $4,325 | $24,532 |
| 2018 | $978 | $28,857 | $4,325 | $24,532 |
| 2017 | $978 | $28,857 | $4,325 | $24,532 |
| 2016 | $1,036 | $28,857 | $4,325 | $24,532 |
| 2015 | $980 | $28,857 | $4,325 | $24,532 |
| 2014 | $980 | $28,857 | $4,325 | $24,532 |
| 2013 | -- | $28,857 | $4,325 | $24,532 |
| 2012 | -- | $28,857 | $4,324 | $24,532 |
Source: Public Records
Map
Nearby Homes
- 0 Pope St Unit 141361
- 111 Sumner St
- 402 N McPhaul St
- 120 Donna Dr
- 103 Dunbar Cir
- 202 N Westberry St
- 202A E Welch St
- 203 E Pinson St
- 000 Georgia 256
- 107 Dunbar Cir
- 122 Dewberry Dr
- 301 Shipp Ln
- 19X Largemouth Dr
- 0 Multiple Lots Unit 141371
- 602 N Isabella St
- 1001 Cordele Rd
- 307 E Pope St
- 707 N Washington St
- 801 N Washington St
- 307 E Hobson St
Your Personal Tour Guide
Ask me questions while you tour the home.