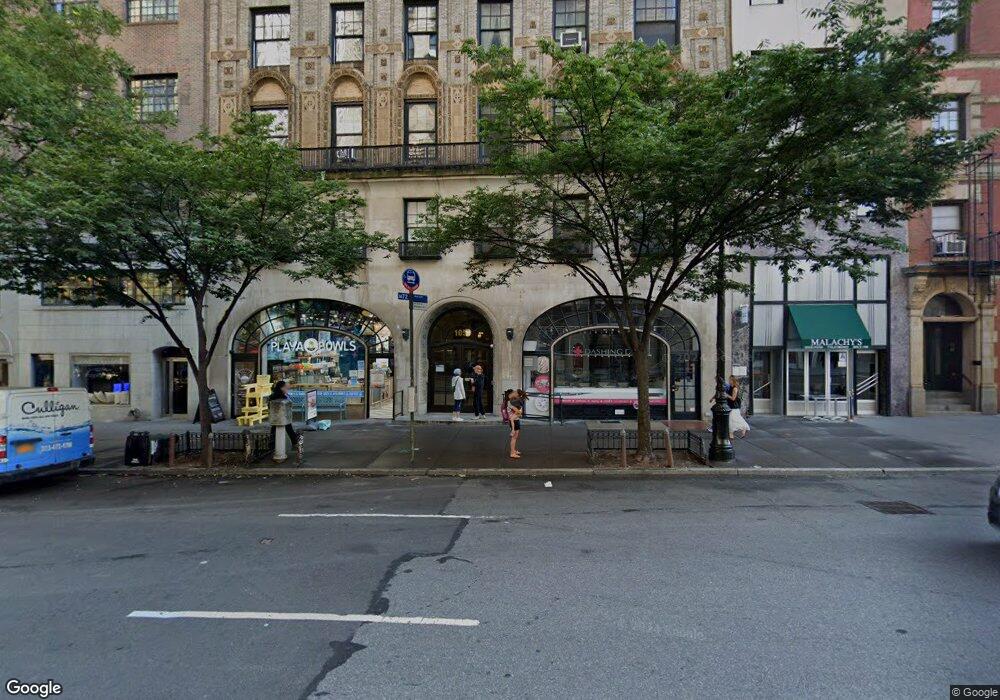
105 W 72nd St Unit 3C New York, NY 10023
Upper West Side NeighborhoodEstimated Value: $1,316,000 - $1,588,000
--
Bed
--
Bath
856
Sq Ft
$1,711/Sq Ft
Est. Value
About This Home
This home is located at 105 W 72nd St Unit 3C, New York, NY 10023 and is currently estimated at $1,464,919, approximately $1,711 per square foot. 105 W 72nd St Unit 3C is a home located in New York County with nearby schools including P.S. 87 William Sherman, Manhattan Star Academy, and West End Day School.
Ownership History
Date
Name
Owned For
Owner Type
Purchase Details
Closed on
May 15, 2007
Sold by
Pinon Alain
Bought by
Menendez Maya
Current Estimated Value
Home Financials for this Owner
Home Financials are based on the most recent Mortgage that was taken out on this home.
Original Mortgage
$416,900
Outstanding Balance
$254,555
Interest Rate
6.24%
Mortgage Type
Purchase Money Mortgage
Estimated Equity
$1,210,364
Purchase Details
Closed on
May 11, 2004
Sold by
Janice Rule Deceased and Kathleen Rule As Executrix Of Janice Ru
Bought by
Alain Pinon
Home Financials for this Owner
Home Financials are based on the most recent Mortgage that was taken out on this home.
Original Mortgage
$540,000
Interest Rate
5.88%
Mortgage Type
Purchase Money Mortgage
Purchase Details
Closed on
Oct 3, 2000
Sold by
72 Associates Lp
Bought by
Rule Janice
Create a Home Valuation Report for This Property
The Home Valuation Report is an in-depth analysis detailing your home's value as well as a comparison with similar homes in the area
Home Values in the Area
Average Home Value in this Area
Purchase History
| Date | Buyer | Sale Price | Title Company |
|---|---|---|---|
| Menendez Maya | $1,189,000 | -- | |
| Menendez Maya | $1,189,000 | -- | |
| Alain Pinon | $720,000 | -- | |
| Alain Pinon | $720,000 | -- | |
| Rule Janice | $424,000 | The Judicial Title Ins Agenc | |
| Rule Janice | $424,000 | The Judicial Title Ins Agenc |
Source: Public Records
Mortgage History
| Date | Status | Borrower | Loan Amount |
|---|---|---|---|
| Open | Menendez Maya | $416,900 | |
| Closed | Menendez Maya | $416,900 | |
| Previous Owner | Alain Pinon | $540,000 |
Source: Public Records
Tax History Compared to Growth
Tax History
| Year | Tax Paid | Tax Assessment Tax Assessment Total Assessment is a certain percentage of the fair market value that is determined by local assessors to be the total taxable value of land and additions on the property. | Land | Improvement |
|---|---|---|---|---|
| 2025 | $21,451 | $153,557 | $24,058 | $129,499 |
| 2024 | $21,451 | $171,578 | $24,058 | $147,520 |
| 2023 | $20,764 | $166,085 | $24,058 | $142,027 |
| 2022 | $19,958 | $162,694 | $24,058 | $138,636 |
| 2021 | $20,799 | $169,556 | $24,058 | $145,498 |
| 2020 | $8,661 | $187,739 | $24,058 | $163,681 |
| 2019 | $16,824 | $183,749 | $24,058 | $159,691 |
| 2018 | $19,399 | $172,735 | $24,058 | $148,677 |
| 2017 | $18,104 | $164,398 | $24,058 | $140,340 |
| 2016 | $17,239 | $161,786 | $24,058 | $137,728 |
| 2015 | $9,369 | $152,394 | $24,058 | $128,336 |
| 2014 | $9,369 | $156,966 | $24,058 | $132,908 |
Source: Public Records
Map
Nearby Homes
- 121 W 72nd St Unit 5C
- 126 W 73rd St Unit 11D
- 112 W 72nd St Unit PHC
- 112 W 72nd St Unit 6G
- 116 W 72nd St Unit 12-C
- 118 W 72nd St Unit 204
- 100 W 72nd St Unit 2AB
- 120 W 72nd St Unit 8B
- 120 W 72nd St Unit 15A
- 132 W 73rd St
- 49 W 72nd St Unit 14E
- 49 W 72nd St Unit 2-C
- 138 W 73rd St
- 119 W 71st St Unit 2C
- 41 W 72nd St Unit 6B
- 41 W 72nd St Unit 7E
- 116 W 74th St
- 54 W 74th St Unit 503
- 51 W 73rd St
- 40 W 72nd St Unit 165
- 105 W 72nd St
- 105 W 72nd St Unit PHC
- 105 W 72nd St Unit 12C
- 105 W 72nd St Unit 11C
- 105 W 72nd St Unit 10C
- 105 W 72nd St Unit 9C
- 105 W 72nd St Unit 8C
- 105 W 72nd St Unit 7C
- 105 W 72nd St Unit 6C
- 105 W 72nd St Unit 5C
- 105 W 72nd St Unit 4C
- 105 W 72nd St Unit 2C
- 105 W 72nd St Unit 12B
- 105 W 72nd St Unit 11B
- 105 W 72nd St Unit 10B
- 105 W 72nd St Unit 9B
- 105 W 72nd St Unit 8B
- 105 W 72nd St Unit 7B
- 105 W 72nd St Unit 6B
- 105 W 72nd St Unit 5B