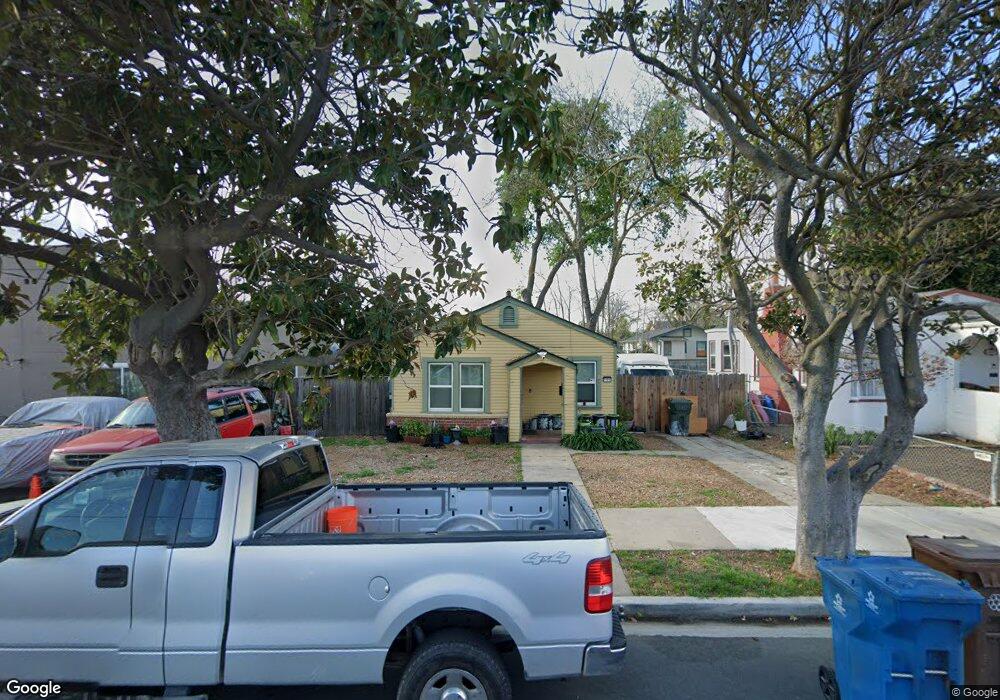
105 W 8th St Antioch, CA 94509
North Antioch NeighborhoodEstimated Value: $345,000 - $382,000
2
Beds
1
Bath
814
Sq Ft
$445/Sq Ft
Est. Value
About This Home
This home is located at 105 W 8th St, Antioch, CA 94509 and is currently estimated at $362,399, approximately $445 per square foot. 105 W 8th St is a home located in Contra Costa County with nearby schools including Fremont Elementary School, Antioch Middle School, and Antioch High School.
Ownership History
Date
Name
Owned For
Owner Type
Purchase Details
Closed on
Apr 4, 2025
Sold by
Kimball-Kubo Family 2018 Trust and Kubo Floyd Norio
Bought by
Ortega Brenda Diaz
Current Estimated Value
Home Financials for this Owner
Home Financials are based on the most recent Mortgage that was taken out on this home.
Original Mortgage
$366,300
Outstanding Balance
$364,736
Interest Rate
6.85%
Mortgage Type
New Conventional
Estimated Equity
-$2,337
Purchase Details
Closed on
Apr 10, 2018
Sold by
Kimball Sandra Jane and Kimball Sandra J
Bought by
Kubo Floyd Norio and Kimball Sandra Jane
Create a Home Valuation Report for This Property
The Home Valuation Report is an in-depth analysis detailing your home's value as well as a comparison with similar homes in the area
Home Values in the Area
Average Home Value in this Area
Purchase History
| Date | Buyer | Sale Price | Title Company |
|---|---|---|---|
| Ortega Brenda Diaz | $382,000 | Old Republic Title | |
| Kubo Floyd Norio | -- | None Available |
Source: Public Records
Mortgage History
| Date | Status | Borrower | Loan Amount |
|---|---|---|---|
| Open | Ortega Brenda Diaz | $366,300 |
Source: Public Records
Tax History
| Year | Tax Paid | Tax Assessment Tax Assessment Total Assessment is a certain percentage of the fair market value that is determined by local assessors to be the total taxable value of land and additions on the property. | Land | Improvement |
|---|---|---|---|---|
| 2025 | $1,562 | $88,767 | $43,273 | $45,494 |
| 2024 | $1,503 | $87,027 | $42,425 | $44,602 |
| 2023 | $1,456 | $85,322 | $41,594 | $43,728 |
| 2022 | $1,439 | $83,650 | $40,779 | $42,871 |
| 2021 | $1,383 | $82,011 | $39,980 | $42,031 |
| 2019 | $1,341 | $79,582 | $38,796 | $40,786 |
| 2018 | $1,293 | $78,023 | $38,036 | $39,987 |
| 2017 | $1,253 | $76,494 | $37,291 | $39,203 |
| 2016 | $1,207 | $74,995 | $36,560 | $38,435 |
| 2015 | $1,184 | $73,869 | $36,011 | $37,858 |
| 2014 | $1,143 | $72,423 | $35,306 | $37,117 |
Source: Public Records
Map
Nearby Homes
Your Personal Tour Guide
Ask me questions while you tour the home.