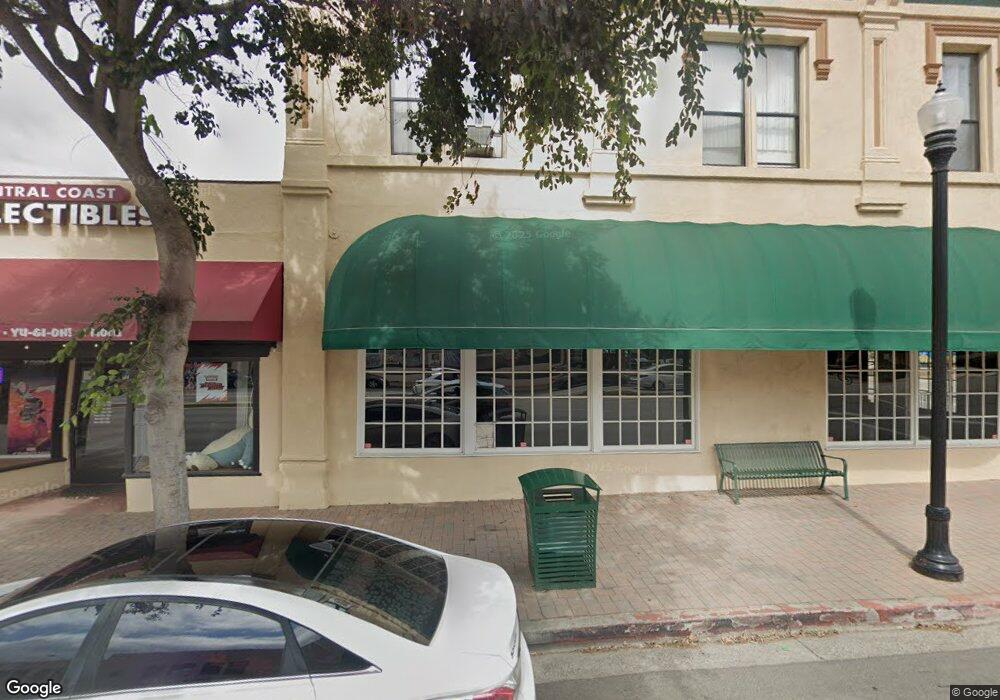
105 W Ocean Ave Lompoc, CA 93436
Estimated Value: $883,178
Studio
--
Bath
--
Sq Ft
10,454
Sq Ft Lot
About This Home
This home is located at 105 W Ocean Ave, Lompoc, CA 93436 and is currently priced at $883,178. 105 W Ocean Ave is a home located in Santa Barbara County with nearby schools including Arthur Hapgood Elementary School, Lompoc Valley Middle School, and Lompoc High School.
Ownership History
Date
Name
Owned For
Owner Type
Purchase Details
Closed on
Dec 6, 2023
Sold by
Schroeder Charles D and Schroeder Wendy J
Bought by
Charles D And Wendy J Schroeder Trust and Schroeder
Current Estimated Value
Purchase Details
Closed on
Apr 27, 2018
Sold by
Dillon Lisa S and Edith May Overholt Trust
Bought by
Overholt William L
Purchase Details
Closed on
Mar 24, 2010
Sold by
Hierholzer Karin Anne
Bought by
Hierholzer Karin Anne and Karin Anne Hierholzer Revocable Living T
Purchase Details
Closed on
Dec 22, 2006
Sold by
Perlin Dorothy E
Bought by
Perlin James J and James & Dorothy Perlin 2006 Trust
Purchase Details
Closed on
Feb 8, 2002
Sold by
Schroeder Herbert E
Bought by
Schroeder Herbert and Herbert Schroeder Trust
Purchase Details
Closed on
Apr 30, 1998
Sold by
Gelzer Mary E
Bought by
Perlin Dorothy E and Schroeder Daniel R
Create a Home Valuation Report for This Property
The Home Valuation Report is an in-depth analysis detailing your home's value as well as a comparison with similar homes in the area
Home Values in the Area
Average Home Value in this Area
Purchase History
| Date | Buyer | Sale Price | Title Company |
|---|---|---|---|
| Charles D And Wendy J Schroeder Trust | -- | None Listed On Document | |
| Overholt William L | -- | None Available | |
| Nagy Claire Overholt | -- | None Available | |
| Dilon Lisa O | -- | None Available | |
| Hierholzer Karin Anne | -- | None Available | |
| Perlin James J | -- | None Available | |
| Schroeder Herbert | -- | -- | |
| Perlin Dorothy E | $1,500 | -- |
Source: Public Records
Tax History Compared to Growth
Tax History
| Year | Tax Paid | Tax Assessment Tax Assessment Total Assessment is a certain percentage of the fair market value that is determined by local assessors to be the total taxable value of land and additions on the property. | Land | Improvement |
|---|---|---|---|---|
| 2025 | $2,297 | $206,618 | $50,382 | $156,236 |
| 2023 | $2,297 | $198,597 | $48,427 | $150,170 |
| 2022 | $2,256 | $194,704 | $47,478 | $147,226 |
| 2021 | $2,278 | $190,888 | $46,548 | $144,340 |
| 2020 | $2,254 | $188,931 | $46,071 | $142,860 |
| 2019 | $2,216 | $185,227 | $45,168 | $140,059 |
| 2018 | $2,182 | $181,596 | $44,283 | $137,313 |
| 2017 | $2,142 | $178,036 | $43,415 | $134,621 |
| 2016 | $2,103 | $174,546 | $42,564 | $131,982 |
| 2014 | $2,058 | $168,558 | $41,104 | $127,454 |
Source: Public Records
Map
Nearby Homes