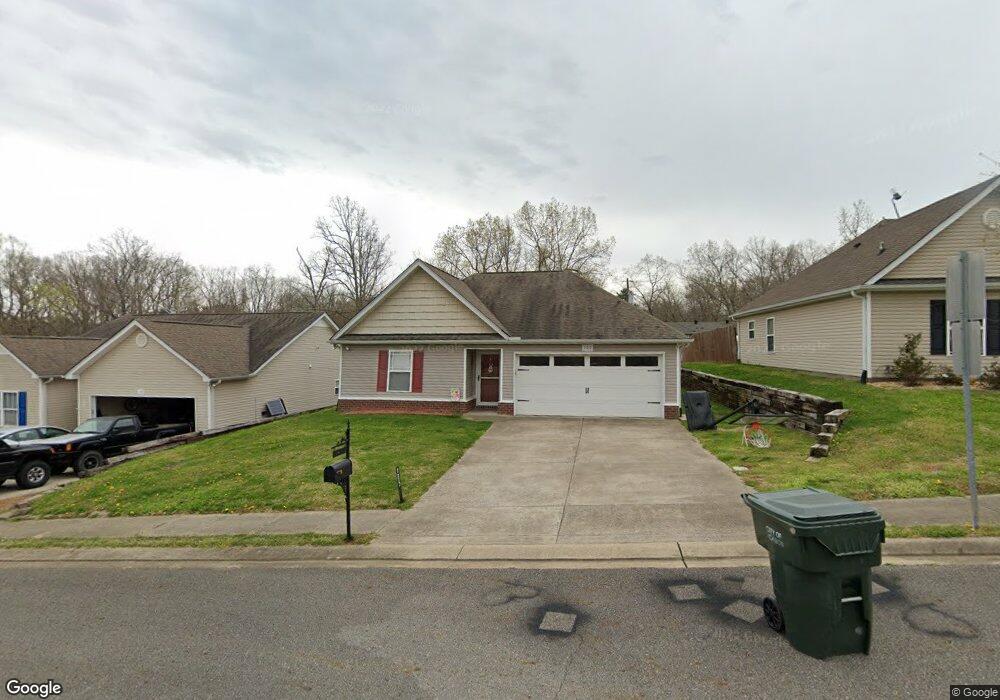
105 W Quail Hollow Way Dickson, TN 37055
Estimated Value: $282,522 - $335,000
--
Bed
2
Baths
1,220
Sq Ft
$254/Sq Ft
Est. Value
About This Home
This home is located at 105 W Quail Hollow Way, Dickson, TN 37055 and is currently estimated at $309,881, approximately $254 per square foot. 105 W Quail Hollow Way is a home located in Dickson County with nearby schools including Oakmont Elementary School, Dickson Middle School, and Dickson County High School.
Ownership History
Date
Name
Owned For
Owner Type
Purchase Details
Closed on
Apr 7, 2021
Sold by
Bishop Mandy G and Lane Mandy G
Bought by
Bishop Mandy G
Current Estimated Value
Home Financials for this Owner
Home Financials are based on the most recent Mortgage that was taken out on this home.
Original Mortgage
$104,000
Outstanding Balance
$93,748
Interest Rate
2.9%
Mortgage Type
New Conventional
Estimated Equity
$216,133
Purchase Details
Closed on
Aug 13, 2012
Sold by
Baxter Christopher M
Bought by
Baxter Mandy G Lane
Purchase Details
Closed on
Feb 26, 2010
Sold by
Charles Raines Constructio
Bought by
Baxter Christopher M
Home Financials for this Owner
Home Financials are based on the most recent Mortgage that was taken out on this home.
Original Mortgage
$127,551
Interest Rate
4.97%
Purchase Details
Closed on
Apr 28, 2008
Bought by
Charles Raines Construction Llc
Create a Home Valuation Report for This Property
The Home Valuation Report is an in-depth analysis detailing your home's value as well as a comparison with similar homes in the area
Home Values in the Area
Average Home Value in this Area
Purchase History
| Date | Buyer | Sale Price | Title Company |
|---|---|---|---|
| Bishop Mandy G | -- | Boston National Title Llc | |
| Baxter Mandy G Lane | -- | -- | |
| Lane Mandy G | -- | -- | |
| Baxter Christopher M | $125,000 | -- | |
| Charles Raines Construction Llc | $97,500 | -- |
Source: Public Records
Mortgage History
| Date | Status | Borrower | Loan Amount |
|---|---|---|---|
| Open | Bishop Mandy G | $104,000 | |
| Previous Owner | Charles Raines Construction Llc | $127,551 |
Source: Public Records
Tax History Compared to Growth
Tax History
| Year | Tax Paid | Tax Assessment Tax Assessment Total Assessment is a certain percentage of the fair market value that is determined by local assessors to be the total taxable value of land and additions on the property. | Land | Improvement |
|---|---|---|---|---|
| 2024 | $1,467 | $66,550 | $11,250 | $55,300 |
| 2023 | $1,467 | $46,975 | $6,825 | $40,150 |
| 2022 | $1,467 | $46,975 | $6,825 | $40,150 |
| 2021 | $1,467 | $46,975 | $6,825 | $40,150 |
| 2020 | $1,467 | $46,975 | $6,825 | $40,150 |
| 2019 | $1,467 | $46,975 | $6,825 | $40,150 |
| 2018 | $1,520 | $41,650 | $7,500 | $34,150 |
| 2017 | $1,520 | $41,650 | $7,500 | $34,150 |
| 2016 | $1,520 | $41,650 | $7,500 | $34,150 |
| 2015 | $1,399 | $36,075 | $7,500 | $28,575 |
| 2014 | $1,399 | $36,075 | $7,500 | $28,575 |
Source: Public Records
Map
Nearby Homes
- 209 E Quail Hollow Way
- 315 Village Ln W
- 412 Village Cir
- 806 Highway 70 E
- 307 Village Ln W
- 823 Highway 70 E
- 109 Village Cir
- 815 Highway 70 E
- 126 Eastdale Ln
- 110 Eastdale Ln
- 0 Forrest Hills Cir
- 109 S Hummingbird Ln
- 123 Eastdale Ln
- 304 E Overhill Dr
- 108 Lake Valley Rd
- 103 Forrest Hills Dr
- 104 Lake Circle Dr
- 108 Lake Circle Dr
- 102 Warren Place
- 103 W Lake Cir
- 107 W Quail Hollow Way
- 103 W Quail Hollow Way
- 109 W Quail Hollow Way
- 102 W Quail Hollow Way
- 106 W Quail Hollow Way W
- 13 W Quail Hollow Way
- 5 5 Quail Hollow Way - Lot 5
- 13 13 Quail Hollow Way - Lot 13
- 5 W Quail Hollow Way Unit 5
- 13 W Quail Hollow Way Unit 13
- 5 W Quail Hollow Way Unit 5, W
- 13 W Quail Hollow Way Unit 13, E
- 19 W Quail Hollow Way
- 5 W Quail Hollow Way
- 17 E Quail Hollow Way
- 20 20 Quail Hollow Way
- 4 4 Quail Hollow Way - Lot 4 W
- 100 W Quail Hollow Way
- 20 W Quail Hollow Way
- 4 W Quail Hollow Way Unit 4