Estimated Value: $188,752
Studio
--
Bath
750
Sq Ft
$252/Sq Ft
Est. Value
About This Home
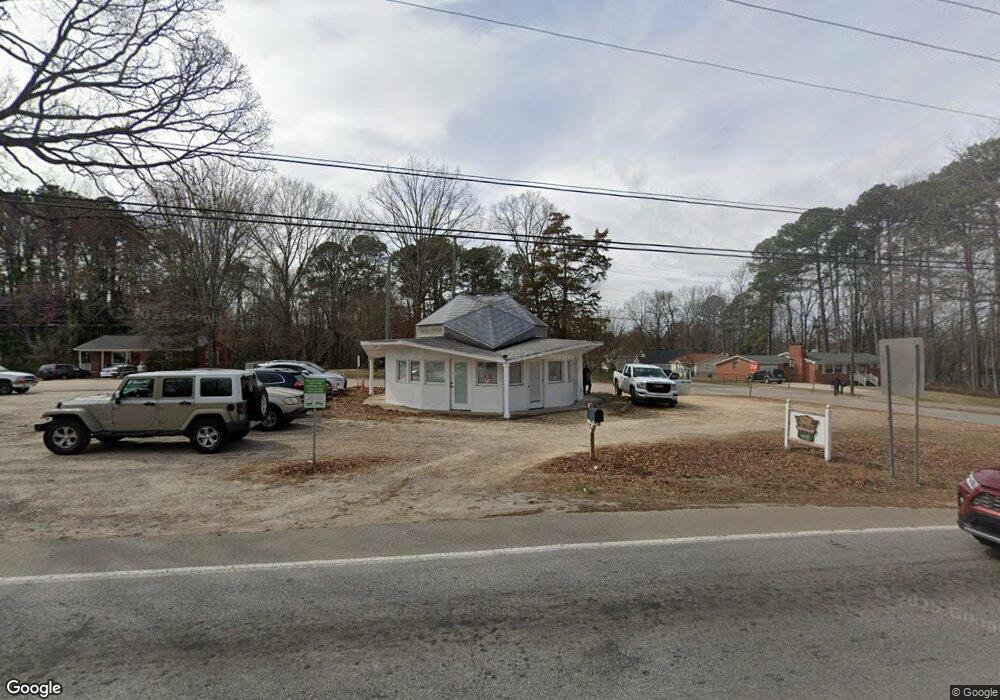
This home is located at 105 W Williams St, Apex, NC 27502 and is currently estimated at $188,752, approximately $251 per square foot. 105 W Williams St is a home located in Wake County with nearby schools including Baucom Elementary School, Apex Middle, and Apex High School.
Ownership History
Date
Name
Owned For
Owner Type
Purchase Details
Closed on
Aug 3, 2023
Sold by
Kyle Valanej and Kyle Brandon
Bought by
Crown Builders And Developers Of Nc Llc
Current Estimated Value
Home Financials for this Owner
Home Financials are based on the most recent Mortgage that was taken out on this home.
Original Mortgage
$144,000
Outstanding Balance
$140,049
Interest Rate
6.67%
Mortgage Type
New Conventional
Estimated Equity
$48,703
Purchase Details
Closed on
Jul 3, 2018
Sold by
Valanejad Arya M
Bought by
Valanejad Sara
Purchase Details
Closed on
Sep 23, 2009
Sold by
Crown Builders & Developers Inc
Bought by
Valanejad Arya M
Purchase Details
Closed on
Apr 20, 2006
Sold by
Bacon Edward and Bacon Marlou Smith
Bought by
Crown Builders & Developers Inc
Home Financials for this Owner
Home Financials are based on the most recent Mortgage that was taken out on this home.
Original Mortgage
$65,450
Interest Rate
6.29%
Mortgage Type
Commercial
Create a Home Valuation Report for This Property
The Home Valuation Report is an in-depth analysis detailing your home's value as well as a comparison with similar homes in the area
Purchase History
| Date | Buyer | Sale Price | Title Company |
|---|---|---|---|
| Crown Builders And Developers Of Nc Llc | -- | None Listed On Document | |
| Valanejad Sara | -- | None Available | |
| Valanejad Arya M | -- | None Available | |
| Crown Builders & Developers Inc | $77,000 | None Available |
Source: Public Records
Mortgage History
| Date | Status | Borrower | Loan Amount |
|---|---|---|---|
| Open | Crown Builders And Developers Of Nc Llc | $144,000 | |
| Previous Owner | Crown Builders & Developers Inc | $65,450 |
Source: Public Records
Tax History
| Year | Tax Paid | Tax Assessment Tax Assessment Total Assessment is a certain percentage of the fair market value that is determined by local assessors to be the total taxable value of land and additions on the property. | Land | Improvement |
|---|---|---|---|---|
| 2025 | $1,044 | $239,082 | $165,614 | $73,468 |
| 2024 | $1,020 | $239,082 | $165,614 | $73,468 |
Source: Public Records
Map
Nearby Homes
- 307 S Elm St
- 1434 Salem Creek Dr
- 506 W Chatham St
- 203 Milky Way Dr
- 111 Lemon Drop Cir
- 1614 Brussels Dr
- 901 Woodbriar St
- 318 Glaston Ct
- 309 Culvert St
- 311 Culvert St
- 300 Pate St
- 105 Cunningham St
- 102 Licorice Dr
- 120 Licorice Dr
- 314 Wrenn St
- 101 Harbor Haven Dr
- 1750 Minley Way
- 104 Fair Spring Ct
- 415 Fairview Rd
- 212 Hunter St
Your Personal Tour Guide
Ask me questions while you tour the home.