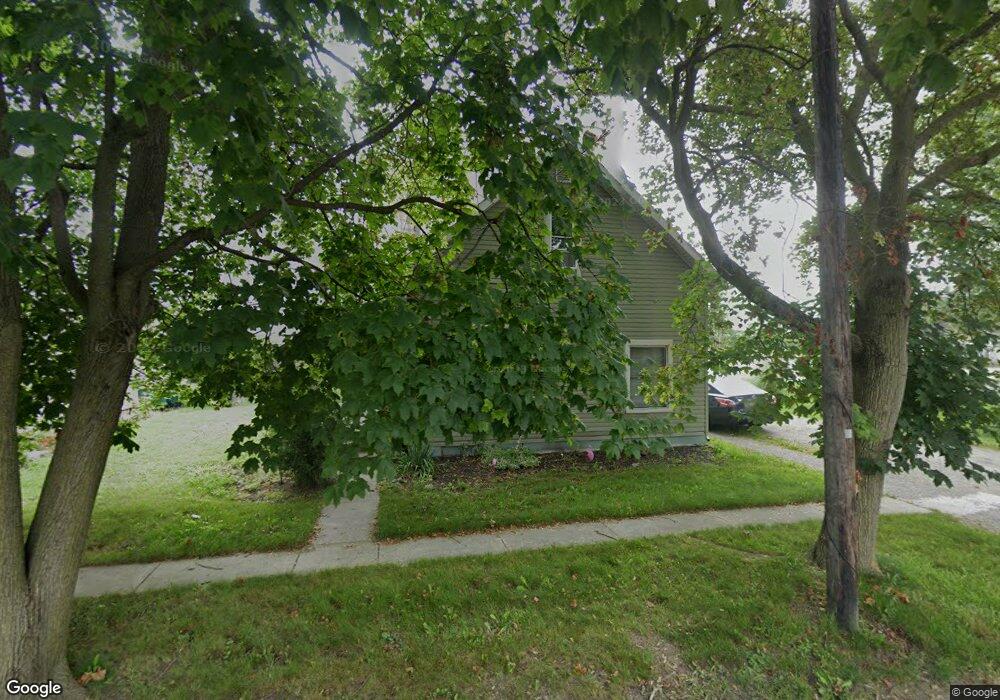
105 Watts St Haskins, OH 43525
Estimated Value: $159,000 - $193,000
3
Beds
1
Bath
1,150
Sq Ft
$147/Sq Ft
Est. Value
About This Home
This home is located at 105 Watts St, Haskins, OH 43525 and is currently estimated at $169,362, approximately $147 per square foot. 105 Watts St is a home located in Wood County with nearby schools including Otsego Elementary School, Otsego Junior High School, and Otsego High School.
Ownership History
Date
Name
Owned For
Owner Type
Purchase Details
Closed on
Sep 29, 2020
Sold by
Palka Christopher D
Bought by
Abbe Terry Lee and Abbe Barbara J
Current Estimated Value
Home Financials for this Owner
Home Financials are based on the most recent Mortgage that was taken out on this home.
Original Mortgage
$106,043
Outstanding Balance
$93,247
Interest Rate
2.9%
Mortgage Type
New Conventional
Estimated Equity
$76,115
Purchase Details
Closed on
Apr 30, 2013
Sold by
Fonseca Jennifer
Bought by
Palka Christopher D
Home Financials for this Owner
Home Financials are based on the most recent Mortgage that was taken out on this home.
Original Mortgage
$84,387
Interest Rate
3.51%
Mortgage Type
New Conventional
Purchase Details
Closed on
Jul 8, 1986
Bought by
Stoner George R
Create a Home Valuation Report for This Property
The Home Valuation Report is an in-depth analysis detailing your home's value as well as a comparison with similar homes in the area
Home Values in the Area
Average Home Value in this Area
Purchase History
| Date | Buyer | Sale Price | Title Company |
|---|---|---|---|
| Abbe Terry Lee | $108,000 | None Available | |
| Palka Christopher D | $92,500 | None Available | |
| Stoner George R | $28,000 | -- |
Source: Public Records
Mortgage History
| Date | Status | Borrower | Loan Amount |
|---|---|---|---|
| Open | Abbe Terry Lee | $106,043 | |
| Previous Owner | Palka Christopher D | $84,387 |
Source: Public Records
Tax History
| Year | Tax Paid | Tax Assessment Tax Assessment Total Assessment is a certain percentage of the fair market value that is determined by local assessors to be the total taxable value of land and additions on the property. | Land | Improvement |
|---|---|---|---|---|
| 2025 | $1,828 | $39,725 | $7,525 | $32,200 |
| 2024 | $1,826 | $39,725 | $7,525 | $32,200 |
| 2023 | $1,821 | $39,730 | $7,530 | $32,200 |
| 2022 | $1,688 | $33,190 | $6,690 | $26,500 |
| 2021 | $1,657 | $33,190 | $6,690 | $26,500 |
| 2020 | $1,665 | $33,190 | $6,690 | $26,500 |
| 2019 | $1,544 | $29,550 | $6,690 | $22,860 |
| 2018 | $1,539 | $29,550 | $6,690 | $22,860 |
| 2017 | $1,458 | $29,550 | $6,690 | $22,860 |
| 2016 | $1,029 | $20,860 | $6,580 | $14,280 |
| 2015 | $1,029 | $20,860 | $6,580 | $14,280 |
| 2014 | $1,059 | $20,860 | $6,580 | $14,280 |
| 2013 | $1,097 | $19,890 | $6,270 | $13,620 |
Source: Public Records
Map
Nearby Homes
- 107 S Findlay St
- 107 S Sullivan Dr
- 104 Earl North Dr
- 116 Earl North Dr
- 201 E Greenwood Dr
- 0 Haskins Rd
- 410 Overlook Dr
- 60 Mount Vernon Ct
- 22 S 5th St
- 0 W River Rd Unit 6134934
- 132 Wilkshire Dr
- 18815 Tontogany Creek Rd
- 305 Ridgepoint Cir
- 0 King Rd Unit 10000333
- 24340 Hull Prairie Rd
- 18722 Crom St
- 25001 W River Rd
- 25216 John F McCarthy Way
- 19330 N Dixie Hwy
- 938 Wilkshire Dr
Your Personal Tour Guide
Ask me questions while you tour the home.