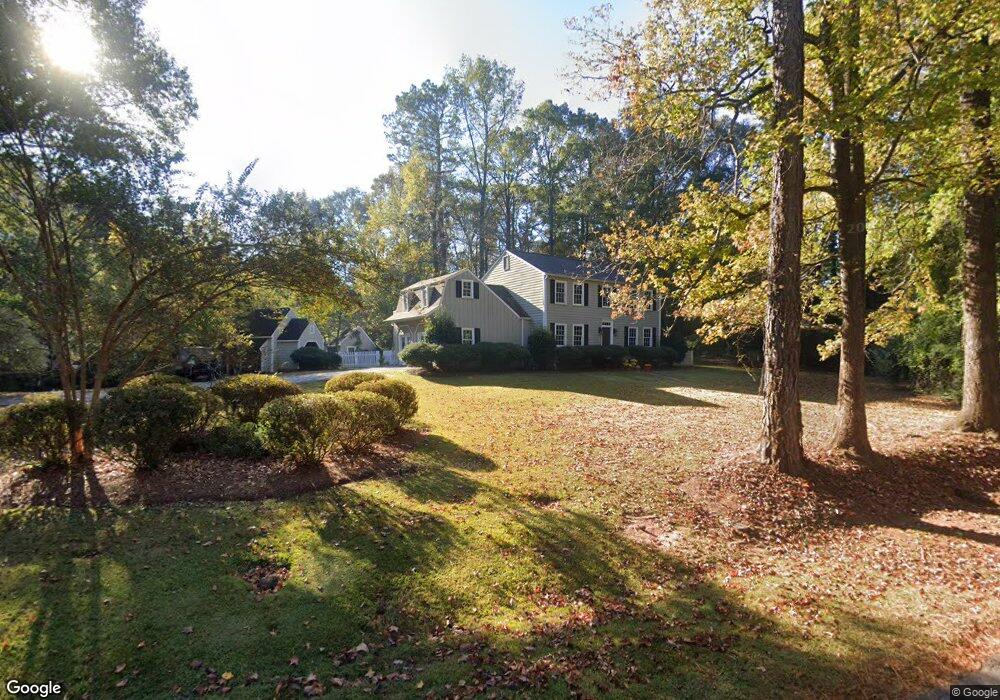
105 Willowcrest Way Lagrange, GA 30240
Estimated Value: $319,724 - $402,000
3
Beds
3
Baths
2,287
Sq Ft
$161/Sq Ft
Est. Value
About This Home
This home is located at 105 Willowcrest Way, Lagrange, GA 30240 and is currently estimated at $367,931, approximately $160 per square foot. 105 Willowcrest Way is a home located in Troup County with nearby schools including Hollis Hand Elementary School, Ethel W. Kight Elementary School, and Franklin Forest Elementary School.
Ownership History
Date
Name
Owned For
Owner Type
Purchase Details
Closed on
Jul 11, 2016
Bought by
Merna James Steven
Current Estimated Value
Home Financials for this Owner
Home Financials are based on the most recent Mortgage that was taken out on this home.
Original Mortgage
$137,600
Outstanding Balance
$84,921
Interest Rate
3.6%
Mortgage Type
Purchase Money Mortgage
Estimated Equity
$283,010
Purchase Details
Closed on
Jun 2, 2015
Sold by
Stanford Nanette
Bought by
Us Bank National Association T
Purchase Details
Closed on
Jul 1, 1999
Sold by
Ridings Ridings W and Ridings Jane
Bought by
Stanford William S and Stanford Nanette
Purchase Details
Closed on
Aug 10, 1995
Sold by
Reid M L
Bought by
Ridings Ridings W and Ridings Jane
Purchase Details
Closed on
Jul 3, 1974
Sold by
Stevens
Bought by
Reid M L
Purchase Details
Closed on
Jan 1, 1974
Sold by
Morgan Morgan and Morgan Daniel
Bought by
Stevens
Purchase Details
Closed on
Jan 1, 1943
Sold by
Wheeless W P
Bought by
Morgan Morgan and Morgan Daniel
Create a Home Valuation Report for This Property
The Home Valuation Report is an in-depth analysis detailing your home's value as well as a comparison with similar homes in the area
Purchase History
| Date | Buyer | Sale Price | Title Company |
|---|---|---|---|
| Merna James Steven | $181,650 | -- | |
| Us Bank National Association T | -- | -- | |
| Stanford William S | $161,000 | -- | |
| Ridings Ridings W | $128,000 | -- | |
| Reid M L | $8,500 | -- | |
| Stevens | -- | -- | |
| Morgan Morgan | -- | -- |
Source: Public Records
Mortgage History
| Date | Status | Borrower | Loan Amount |
|---|---|---|---|
| Open | Merna James Steven | $137,600 |
Source: Public Records
Tax History
| Year | Tax Paid | Tax Assessment Tax Assessment Total Assessment is a certain percentage of the fair market value that is determined by local assessors to be the total taxable value of land and additions on the property. | Land | Improvement |
|---|---|---|---|---|
| 2025 | $2,920 | $126,376 | $18,000 | $108,376 |
| 2024 | $2,920 | $107,056 | $18,000 | $89,056 |
| 2023 | $2,948 | $108,096 | $18,000 | $90,096 |
| 2022 | $2,862 | $102,536 | $18,000 | $84,536 |
| 2021 | $2,158 | $71,536 | $14,000 | $57,536 |
| 2020 | $2,158 | $71,536 | $14,000 | $57,536 |
| 2019 | $2,232 | $74,016 | $14,000 | $60,016 |
| 2018 | $2,224 | $73,748 | $17,040 | $56,708 |
| 2017 | $2,191 | $73,748 | $17,040 | $56,708 |
| 2016 | $2,059 | $68,277 | $18,000 | $50,277 |
| 2015 | $2,063 | $68,277 | $18,000 | $50,277 |
| 2014 | $2,343 | $77,436 | $12,000 | $65,436 |
| 2013 | -- | $77,436 | $12,000 | $65,436 |
Source: Public Records
Map
Nearby Homes
- 214 Willowcrest Way
- 960 Cameron Mill Rd
- 1000 Foxcroft Dr
- 0 Cameron Mill Rd Unit 10640133
- 641 Whitaker Rd
- 102 Millridge Dr
- 114 Millridge Dr
- 217 Highland Trail
- 104 Spring Valley Dr
- 101 Deal Dr
- 203 Shawnee Dr
- 200 Cheyenne Dr
- 117 Brookwood Dr
- 223 Pinehaven Dr
- 116 Deal Dr
- 336 Whitaker Rd
- 303 W Lakeview Dr
- 229 W Lakeview Dr
- 207 Lakeshore Dr
- 106 Highland Park
- 113 Willowcrest Way
- 201 Willowcrest Way
- 201 Willowcrest Way Unit 57
- 109 Willowcrest Way
- 104 Willowcrest Way
- 100 N Willowcrest Rd
- 101 Willowcrest Way
- 106 Willowcrest Way
- 203 Willowcrest Way
- 108 Willowcrest Way
- 99 Willowcrest Way
- 102 Willowcrest Way
- 249 Willowcrest Way
- 251 Willowcrest Way
- 112 Willowcrest Way
- 247 Baywood Cir
- 205 Willowcrest Way
- 1001 Cameron Mill Rd
- 1001 Cameron Mill Rd Unit 5B
- 110 Willowcrest Way
Your Personal Tour Guide
Ask me questions while you tour the home.