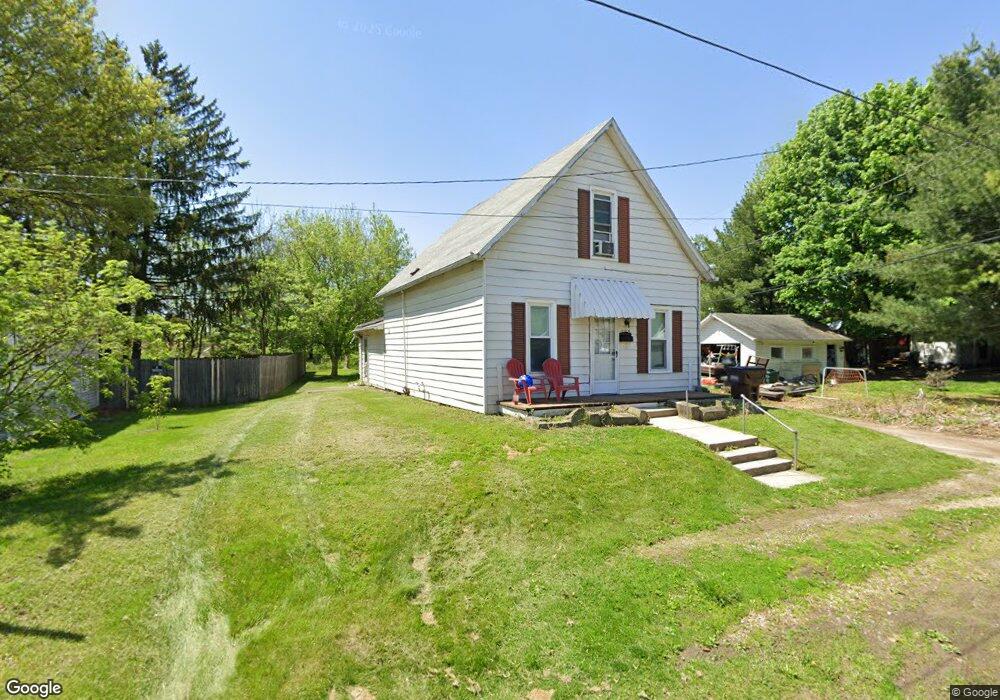
105 Wilson St Mount Vernon, OH 43050
Estimated Value: $120,000 - $209,000
3
Beds
2
Baths
839
Sq Ft
$177/Sq Ft
Est. Value
About This Home
This home is located at 105 Wilson St, Mount Vernon, OH 43050 and is currently estimated at $148,706, approximately $177 per square foot. 105 Wilson St is a home located in Knox County with nearby schools including Mount Vernon High School, St. Vincent de Paul School, and Christian Star Academy.
Ownership History
Date
Name
Owned For
Owner Type
Purchase Details
Closed on
Feb 4, 2009
Sold by
Booth Mike and Doe Jane
Bought by
Deutsche Bank Trust Company Americas
Current Estimated Value
Purchase Details
Closed on
Jan 14, 2009
Sold by
Deutsche Bank Trust Company Americas
Bought by
Waggoner George
Purchase Details
Closed on
May 31, 2002
Sold by
Adkins Roy B and Adkins Annika U
Bought by
Macafee Monica R Aka Moni
Purchase Details
Closed on
Feb 17, 2000
Sold by
Gump James Lee and Gump Marilyn
Bought by
Adkins Roy B and Adkins Annika U
Create a Home Valuation Report for This Property
The Home Valuation Report is an in-depth analysis detailing your home's value as well as a comparison with similar homes in the area
Home Values in the Area
Average Home Value in this Area
Purchase History
| Date | Buyer | Sale Price | Title Company |
|---|---|---|---|
| Deutsche Bank Trust Company Americas | $36,000 | None Available | |
| Waggoner George | $21,625 | None Available | |
| Macafee Monica R Aka Moni | $70,500 | -- | |
| Adkins Roy B | $57,000 | -- |
Source: Public Records
Tax History Compared to Growth
Tax History
| Year | Tax Paid | Tax Assessment Tax Assessment Total Assessment is a certain percentage of the fair market value that is determined by local assessors to be the total taxable value of land and additions on the property. | Land | Improvement |
|---|---|---|---|---|
| 2024 | $1,131 | $28,580 | $7,440 | $21,140 |
| 2023 | $1,131 | $28,580 | $7,440 | $21,140 |
| 2022 | $951 | $21,820 | $5,680 | $16,140 |
| 2021 | $951 | $21,820 | $5,680 | $16,140 |
| 2020 | $926 | $21,820 | $5,680 | $16,140 |
| 2019 | $957 | $21,020 | $9,620 | $11,400 |
| 2018 | $959 | $21,020 | $9,620 | $11,400 |
| 2017 | $943 | $21,020 | $9,620 | $11,400 |
| 2016 | $875 | $19,460 | $8,900 | $10,560 |
| 2015 | $879 | $19,460 | $8,900 | $10,560 |
| 2014 | $1,316 | $19,460 | $8,900 | $10,560 |
| 2013 | $966 | $20,200 | $8,370 | $11,830 |
Source: Public Records
Map
Nearby Homes