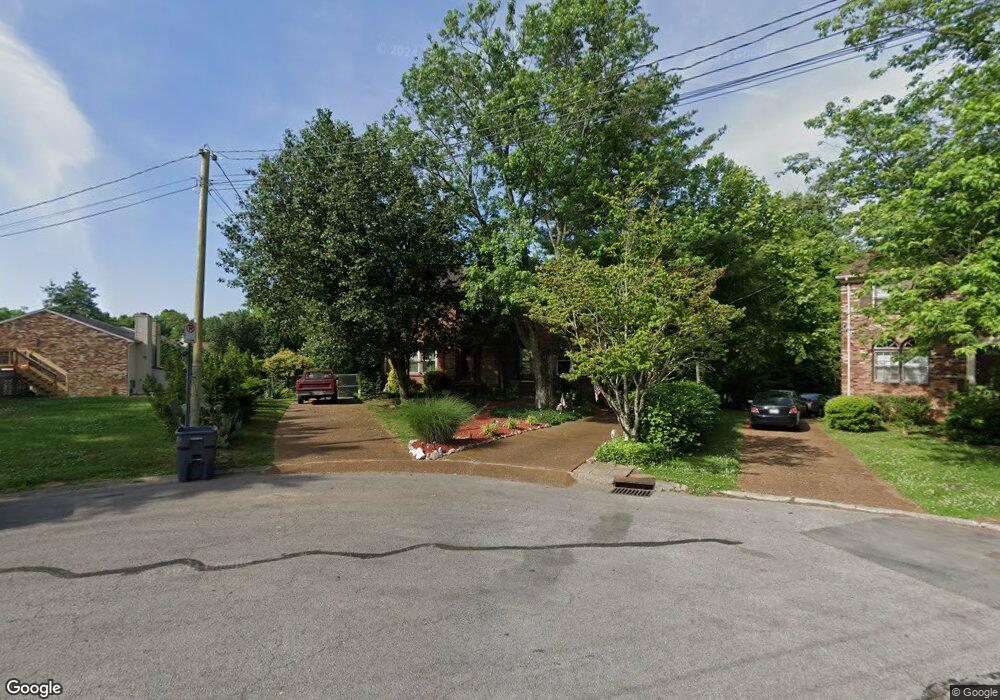
105 Woodcraft Ct Nashville, TN 37214
Hermitage NeighborhoodEstimated Value: $297,000 - $309,000
3
Beds
3
Baths
1,584
Sq Ft
$193/Sq Ft
Est. Value
About This Home
This home is located at 105 Woodcraft Ct, Nashville, TN 37214 and is currently estimated at $304,976, approximately $192 per square foot. 105 Woodcraft Ct is a home located in Davidson County with nearby schools including Hickman Elementary School, Donelson Middle School, and McGavock High School.
Ownership History
Date
Name
Owned For
Owner Type
Purchase Details
Closed on
Oct 31, 2024
Sold by
Angel Juan Hurtado
Bought by
Hurtado Dafne G
Current Estimated Value
Purchase Details
Closed on
Sep 9, 2024
Sold by
Hurtado Dafne G
Bought by
Angel Juan Hurtado
Purchase Details
Closed on
Aug 20, 2020
Sold by
Walker Michael and Walker William Joseph
Bought by
Hurtado Jose
Purchase Details
Closed on
Aug 10, 2007
Sold by
Hibner Paul H and Hibner Mary E
Bought by
Walker Stephen P
Home Financials for this Owner
Home Financials are based on the most recent Mortgage that was taken out on this home.
Original Mortgage
$73,080
Interest Rate
6.63%
Mortgage Type
FHA
Purchase Details
Closed on
Jan 21, 1999
Sold by
Labrec Robert E
Bought by
Hibner Paul H and Hibner Mary E
Home Financials for this Owner
Home Financials are based on the most recent Mortgage that was taken out on this home.
Original Mortgage
$72,294
Interest Rate
6.72%
Mortgage Type
FHA
Create a Home Valuation Report for This Property
The Home Valuation Report is an in-depth analysis detailing your home's value as well as a comparison with similar homes in the area
Home Values in the Area
Average Home Value in this Area
Purchase History
| Date | Buyer | Sale Price | Title Company |
|---|---|---|---|
| Hurtado Dafne G | -- | Wagon Wheel Title | |
| Angel Juan Hurtado | -- | Wagon Wheel Title | |
| Hurtado Jose | $120,000 | Cnmpass Land Tille Llc | |
| Walker Stephen P | $114,000 | Cumberland Title | |
| Hibner Paul H | $1,500 | -- |
Source: Public Records
Mortgage History
| Date | Status | Borrower | Loan Amount |
|---|---|---|---|
| Previous Owner | Walker Stephen P | $73,080 | |
| Previous Owner | Hibner Paul H | $72,294 |
Source: Public Records
Tax History Compared to Growth
Tax History
| Year | Tax Paid | Tax Assessment Tax Assessment Total Assessment is a certain percentage of the fair market value that is determined by local assessors to be the total taxable value of land and additions on the property. | Land | Improvement |
|---|---|---|---|---|
| 2025 | $2,388 | $85,825 | $15,200 | $70,625 |
| 2024 | $1,631 | $55,825 | $9,750 | $46,075 |
| 2023 | $1,631 | $55,825 | $9,750 | $46,075 |
| 2022 | $1,631 | $55,825 | $9,750 | $46,075 |
| 2021 | $1,472 | $49,850 | $9,750 | $40,100 |
| 2020 | $1,467 | $38,725 | $6,600 | $32,125 |
| 2019 | $1,067 | $38,725 | $6,600 | $32,125 |
| 2018 | $1,067 | $38,725 | $6,600 | $32,125 |
| 2017 | $1,067 | $38,725 | $6,600 | $32,125 |
| 2016 | $1,154 | $29,400 | $3,575 | $25,825 |
| 2015 | $1,154 | $29,400 | $3,575 | $25,825 |
| 2014 | $1,154 | $29,400 | $3,575 | $25,825 |
Source: Public Records
Map
Nearby Homes
- 208 Woodmaker Ct
- 109 New Haven Ct
- 237 Woodmaker Ct
- 1332 Timber Valley Dr
- 1015 Hammack Ct
- 1020 Hammack Ct
- 1229 Timber Valley Dr
- 2201 S Ashford Ct
- 243 Timberway Dr Unit 141
- 1500 Trailwood Ct
- 1333 Island View Ct
- 1314 Quail Valley Rd Unit 19
- 1313 Priest Woods Ct
- 321 Timberway Cir Unit 109
- 301 Poplar Hill Ct
- 1228 Quail Rd
- 1608 Western Shore Dr
- 3215 Trails End Ln
- 3199 Trails End Ln
- 501 Williamsburg Dr Unit 501
- 107 Woodcraft Ct
- 821 Woodcraft Dr
- 103 Woodcraft Ct
- 819 Woodcraft Dr
- 109 Woodcraft Ct
- 817 Woodcraft Dr
- 101 Woodcraft Ct
- 111 Woodcraft Ct
- 737 Woodcraft Dr
- 110 Woodcraft Ct
- 829 Woodcraft Dr
- 826 Woodcraft Dr
- 108 Woodcraft Ct
- 733 Woodcraft Dr
- 828 Woodcraft Dr
- 831 Woodcraft Dr
- 903 Hammack Dr
- 104 Woodcraft Ct
- 106 Woodcraft Ct