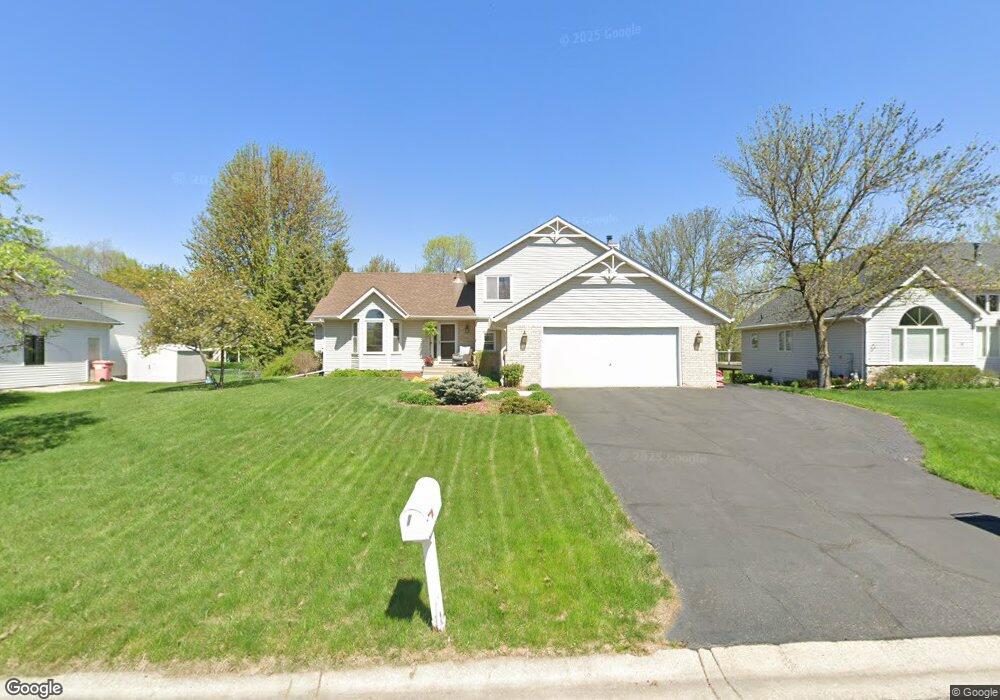
1050 Bluff Pass N Chaska, MN 55318
Estimated Value: $493,442 - $569,000
4
Beds
3
Baths
2,282
Sq Ft
$229/Sq Ft
Est. Value
About This Home
This home is located at 1050 Bluff Pass N, Chaska, MN 55318 and is currently estimated at $522,611, approximately $229 per square foot. 1050 Bluff Pass N is a home located in Carver County with nearby schools including Clover Ridge Elementary School, Chaska Middle School West, and Chaska High School.
Ownership History
Date
Name
Owned For
Owner Type
Purchase Details
Closed on
Nov 24, 2017
Sold by
Anderson Kurtis Wayne and Anderson Lisa Seaman
Bought by
Anderson Lisa Seaman
Current Estimated Value
Home Financials for this Owner
Home Financials are based on the most recent Mortgage that was taken out on this home.
Original Mortgage
$202,500
Interest Rate
4.22%
Mortgage Type
New Conventional
Purchase Details
Closed on
Nov 15, 2002
Sold by
Mendez Aurello M and Mendez Lima A
Bought by
Anderson Kurtiswayne and Anderson Lisa Seaman
Purchase Details
Closed on
Sep 30, 1999
Sold by
Cloutier Michael J
Bought by
Mendez Aurelio M and Mendez Irma A
Purchase Details
Closed on
Aug 25, 1998
Sold by
Korstad Thomas A and Korstad Betty R
Bought by
Cloutier Michael J
Create a Home Valuation Report for This Property
The Home Valuation Report is an in-depth analysis detailing your home's value as well as a comparison with similar homes in the area
Home Values in the Area
Average Home Value in this Area
Purchase History
| Date | Buyer | Sale Price | Title Company |
|---|---|---|---|
| Anderson Lisa Seaman | -- | None Available | |
| Anderson Kurtiswayne | $275,000 | -- | |
| Mendez Aurelio M | $230,000 | -- | |
| Cloutier Michael J | $210,000 | -- |
Source: Public Records
Mortgage History
| Date | Status | Borrower | Loan Amount |
|---|---|---|---|
| Previous Owner | Anderson Lisa Seaman | $202,500 |
Source: Public Records
Tax History
| Year | Tax Paid | Tax Assessment Tax Assessment Total Assessment is a certain percentage of the fair market value that is determined by local assessors to be the total taxable value of land and additions on the property. | Land | Improvement |
|---|---|---|---|---|
| 2025 | $5,176 | $460,400 | $130,000 | $330,400 |
| 2024 | $5,048 | $436,800 | $130,000 | $306,800 |
| 2023 | $4,746 | $430,100 | $130,000 | $300,100 |
| 2022 | $4,530 | $421,900 | $121,800 | $300,100 |
| 2021 | $4,302 | $359,100 | $101,500 | $257,600 |
| 2020 | $4,336 | $359,100 | $101,500 | $257,600 |
| 2019 | $4,264 | $338,700 | $96,600 | $242,100 |
| 2018 | $4,156 | $338,700 | $96,600 | $242,100 |
| 2017 | $4,100 | $327,600 | $87,900 | $239,700 |
| 2016 | $3,944 | $284,000 | $0 | $0 |
| 2015 | $3,526 | $260,300 | $0 | $0 |
| 2014 | $3,526 | $242,100 | $0 | $0 |
Source: Public Records
Map
Nearby Homes
- 14 Rita Ln
- 2890 Autumn Woods Dr
- 2888 Forest Ridge
- 2338 Manuela Dr
- 2906 Butternut Dr
- 1840 Freedom Ln Unit 104
- 9580 Madison Dr Unit 4
- 3031 Sugar Maple Dr
- 9620 Washington Blvd Unit 1
- 9575 Jefferson Dr Unit 1
- 1846 Plymouth Ln Unit 101
- 3130 Sugar Maple Dr
- 1952 Commonwealth Blvd Unit 4
- 1949 Commonwealth Blvd Unit 2
- 312 Wagon Wheel Ln Unit 16
- 9534 Roosevelt Dr
- 319 Wilderness Dr Unit 22
- 1944 Commonwealth Blvd Unit 3
- 9514 Roosevelt Dr
- 1525 Hemlock Way
- 1060 Bluff Pass N
- 1040 Bluff Pass N
- 1070 Bluff Pass N
- 1030 Bluff Pass N
- 1051 Bluff Pass N
- 1041 Bluff Pass N
- 1051 Wildwood Way
- 1031 Bluff Pass N
- 1061 Wildwood Way
- 1061 Bluff Pass N
- 1020 Bluff Pass N
- 1020 1020 Bluff-Pass-n
- 1080 Bluff Pass N
- 1041 Wildwood Way
- 1021 Bluff Pass N
- 1066 Overlook Dr
- 1071 Wildwood Way
- 1081 Bluff Pass N
- 1010 Bluff Pass N
- 1090 Bluff Pass N
Your Personal Tour Guide
Ask me questions while you tour the home.