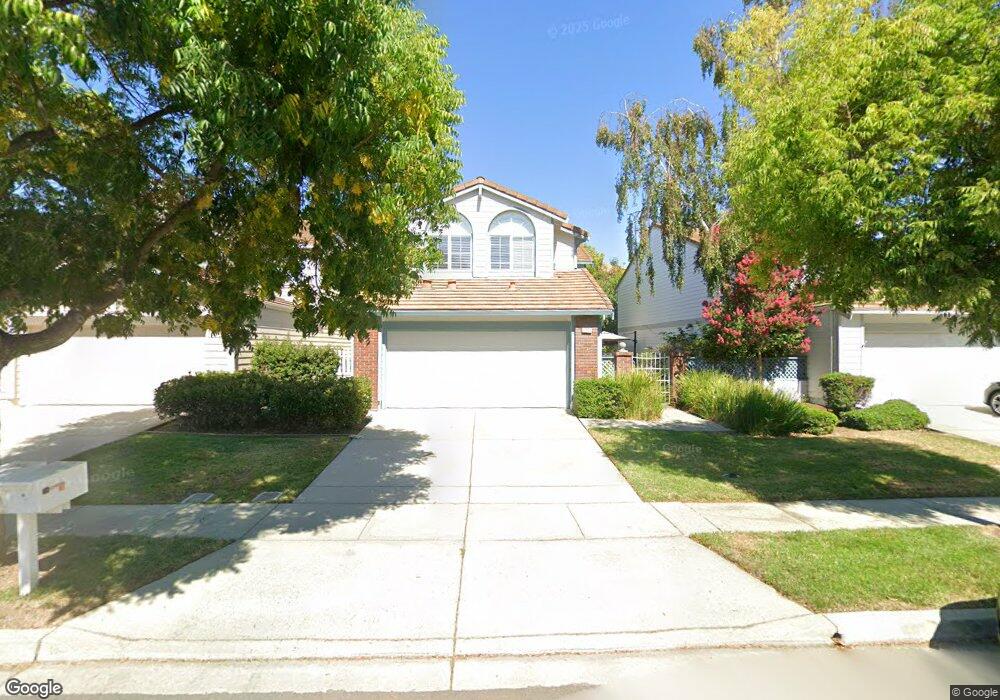
1050 Chipman Dr Milpitas, CA 95035
Estimated Value: $1,789,788 - $2,166,000
4
Beds
3
Baths
1,939
Sq Ft
$1,000/Sq Ft
Est. Value
About This Home
This home is located at 1050 Chipman Dr, Milpitas, CA 95035 and is currently estimated at $1,939,697, approximately $1,000 per square foot. 1050 Chipman Dr is a home located in Santa Clara County with nearby schools including John Sinnott Elementary School, Rancho Milpitas Middle School, and Milpitas High School.
Ownership History
Date
Name
Owned For
Owner Type
Purchase Details
Closed on
Nov 8, 2018
Sold by
Hampel Tony and Hampel Catherine
Bought by
Hampel Anthony and Hampel Catherine
Current Estimated Value
Purchase Details
Closed on
Dec 6, 2001
Sold by
Hampel Anthony and Hampel Catherine
Bought by
Hampel Anthony and Hampel Catherine
Home Financials for this Owner
Home Financials are based on the most recent Mortgage that was taken out on this home.
Original Mortgage
$195,470
Interest Rate
6.57%
Create a Home Valuation Report for This Property
The Home Valuation Report is an in-depth analysis detailing your home's value as well as a comparison with similar homes in the area
Home Values in the Area
Average Home Value in this Area
Purchase History
| Date | Buyer | Sale Price | Title Company |
|---|---|---|---|
| Hampel Anthony | -- | None Available | |
| Hampel Anthony | -- | Stewart Title |
Source: Public Records
Mortgage History
| Date | Status | Borrower | Loan Amount |
|---|---|---|---|
| Closed | Hampel Anthony | $195,470 |
Source: Public Records
Tax History
| Year | Tax Paid | Tax Assessment Tax Assessment Total Assessment is a certain percentage of the fair market value that is determined by local assessors to be the total taxable value of land and additions on the property. | Land | Improvement |
|---|---|---|---|---|
| 2025 | $6,819 | $591,591 | $207,412 | $384,179 |
| 2024 | $6,819 | $579,993 | $203,346 | $376,647 |
| 2023 | $6,796 | $568,621 | $199,359 | $369,262 |
| 2022 | $6,768 | $557,472 | $195,450 | $362,022 |
| 2021 | $6,669 | $546,542 | $191,618 | $354,924 |
| 2020 | $6,553 | $540,939 | $189,654 | $351,285 |
| 2019 | $6,478 | $530,334 | $185,936 | $344,398 |
| 2018 | $6,154 | $519,937 | $182,291 | $337,646 |
| 2017 | $6,074 | $509,743 | $178,717 | $331,026 |
| 2016 | $5,827 | $499,749 | $175,213 | $324,536 |
| 2015 | $5,767 | $492,244 | $172,582 | $319,662 |
| 2014 | $5,606 | $482,603 | $169,202 | $313,401 |
Source: Public Records
Map
Nearby Homes
- 2235 Skyline Dr
- 2698 Greenrock Rd
- 1621 Tahoe Dr
- 2178 Ashwood Ln
- 3312 Birchwood Ln
- 2074 Ashwood Ln
- 2085 Ashwood Ln
- 3278 Sagewood Ln
- 1394 Glacier Dr
- 1260 Glacier Dr
- 1787 Canton Dr
- 320 Monmouth Dr
- 3184 Fernside Square
- 529 Bryce Ct
- 1039 Big Bear Ct
- 3023 Postwood Dr
- 1912 Vinedale Square
- 397 S Park Victoria Dr
- 484 Dempsey Rd Unit 186
- 1647 Jupiter Dr
- 1056 Chipman Dr
- 1044 Chipman Dr
- 1062 Chipman Dr
- 2232 Lynwood Terrace
- 1068 Chipman Dr
- 2238 Lynwood Terrace
- 2249 Farmcrest St
- 1036 Chipman Dr
- 1074 Chipman Dr
- 2244 Lynwood Terrace
- 2255 Farmcrest St
- 1030 Chipman Dr
- 2250 Lynwood Terrace
- 2261 Farmcrest St
- 2229 Lynwood Terrace
- 2235 Lynwood Terrace
- 1024 Chipman Dr
- 2267 Farmcrest St
- 2256 Lynwood Terrace
- 2241 Lynwood Terrace
Your Personal Tour Guide
Ask me questions while you tour the home.