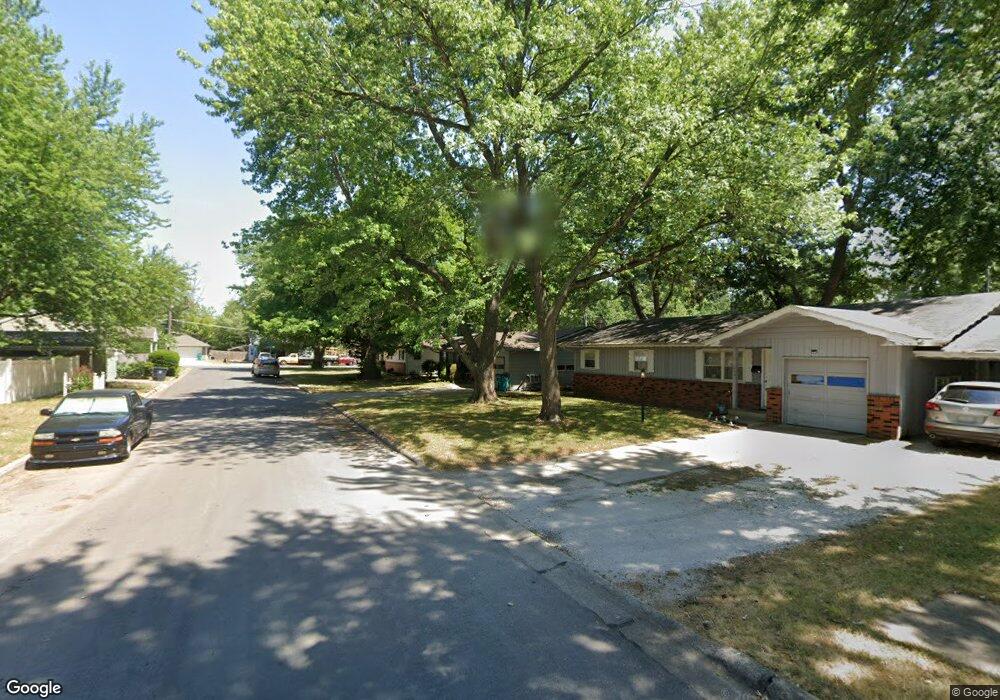
1050 E McGee St Springfield, MO 65807
Seminole Holland NeighborhoodEstimated Value: $188,000 - $205,000
3
Beds
2
Baths
1,288
Sq Ft
$151/Sq Ft
Est. Value
About This Home
This home is located at 1050 E McGee St, Springfield, MO 65807 and is currently estimated at $194,523, approximately $151 per square foot. 1050 E McGee St is a home located in Greene County with nearby schools including Holland Elementary School, Jarrett Middle, and Parkview High School.
Ownership History
Date
Name
Owned For
Owner Type
Purchase Details
Closed on
Feb 12, 2021
Sold by
Hawkins Thomas S and Hawkins Kristin M
Bought by
Mcadoo Ian M
Current Estimated Value
Home Financials for this Owner
Home Financials are based on the most recent Mortgage that was taken out on this home.
Original Mortgage
$127,555
Outstanding Balance
$113,985
Interest Rate
2.65%
Mortgage Type
New Conventional
Estimated Equity
$80,538
Purchase Details
Closed on
Oct 18, 2017
Sold by
Hughes Amanda Lea and Hughes Dalton
Bought by
Mcmillian Melinda and Mcmillian Larry
Purchase Details
Closed on
Jan 29, 2010
Sold by
Renfro Karen and Williams Karen
Bought by
Fox James Albert and Fox Judith Kay
Home Financials for this Owner
Home Financials are based on the most recent Mortgage that was taken out on this home.
Original Mortgage
$84,000
Interest Rate
4.93%
Mortgage Type
Purchase Money Mortgage
Create a Home Valuation Report for This Property
The Home Valuation Report is an in-depth analysis detailing your home's value as well as a comparison with similar homes in the area
Home Values in the Area
Average Home Value in this Area
Purchase History
| Date | Buyer | Sale Price | Title Company |
|---|---|---|---|
| Mcadoo Ian M | -- | None Available | |
| Mcmillian Melinda | -- | None Available | |
| Fox James Albert | -- | Meridian Title Company |
Source: Public Records
Mortgage History
| Date | Status | Borrower | Loan Amount |
|---|---|---|---|
| Open | Mcadoo Ian M | $127,555 | |
| Previous Owner | Fox James Albert | $84,000 |
Source: Public Records
Tax History
| Year | Tax Paid | Tax Assessment Tax Assessment Total Assessment is a certain percentage of the fair market value that is determined by local assessors to be the total taxable value of land and additions on the property. | Land | Improvement |
|---|---|---|---|---|
| 2025 | $1,121 | $22,500 | $5,700 | $16,800 |
| 2024 | $1,051 | $19,590 | $3,760 | $15,830 |
| 2023 | $1,045 | $19,590 | $3,760 | $15,830 |
| 2022 | $1,001 | $18,330 | $3,760 | $14,570 |
| 2021 | $1,001 | $18,330 | $3,760 | $14,570 |
| 2020 | $931 | $16,300 | $3,760 | $12,540 |
| 2019 | $905 | $16,300 | $3,760 | $12,540 |
| 2018 | $929 | $16,740 | $3,760 | $12,980 |
| 2017 | $919 | $14,930 | $3,760 | $11,170 |
| 2016 | $818 | $14,930 | $3,760 | $11,170 |
| 2015 | $811 | $14,930 | $3,760 | $11,170 |
| 2014 | $782 | $14,290 | $3,760 | $10,530 |
Source: Public Records
Map
Nearby Homes
- 1040 E Cherokee St
- 2048 S Florence Ave
- 2147 S Hampton Ave
- 2114 S Windsor Dr
- 1844 S Dollison Ave
- 2323 S Hampton Ave
- 1100 E University St
- 1229 E Berkeley St
- 1220 E University St
- 1057 E Stanford St
- 2365 S Dollison Ave
- 535 E Whiteside St
- 620 E Sunshine St
- 820 E Stanford St
- 2431 S Kings Ave
- 2012 S Roanoke Ave
- 2344 S Kickapoo Ave
- 2337 S Holland Ave
- 1847 S Collinson Ave
- 1449 E Berkeley St
- 1042 E McGee St
- 1056 E McGee St
- 2041 S Hampton Ave
- 1034 E McGee St
- 2015 S Hampton Ave
- 1041 E McGee St
- 2055 S Hampton Ave
- 1033 E McGee St
- 1026 E McGee St
- 2032 S Hampton Ave
- 2028 S Hampton Ave
- 2036 S Hampton Ave
- 1048 E Cherokee St
- 2014 S Hampton Ave
- 2059 S Hampton Ave
- 1027 E McGee St
- 1054 E Cherokee St
- 1038 E Cherokee St
- 1018 E McGee St
- 2012 S Hampton Ave
Your Personal Tour Guide
Ask me questions while you tour the home.