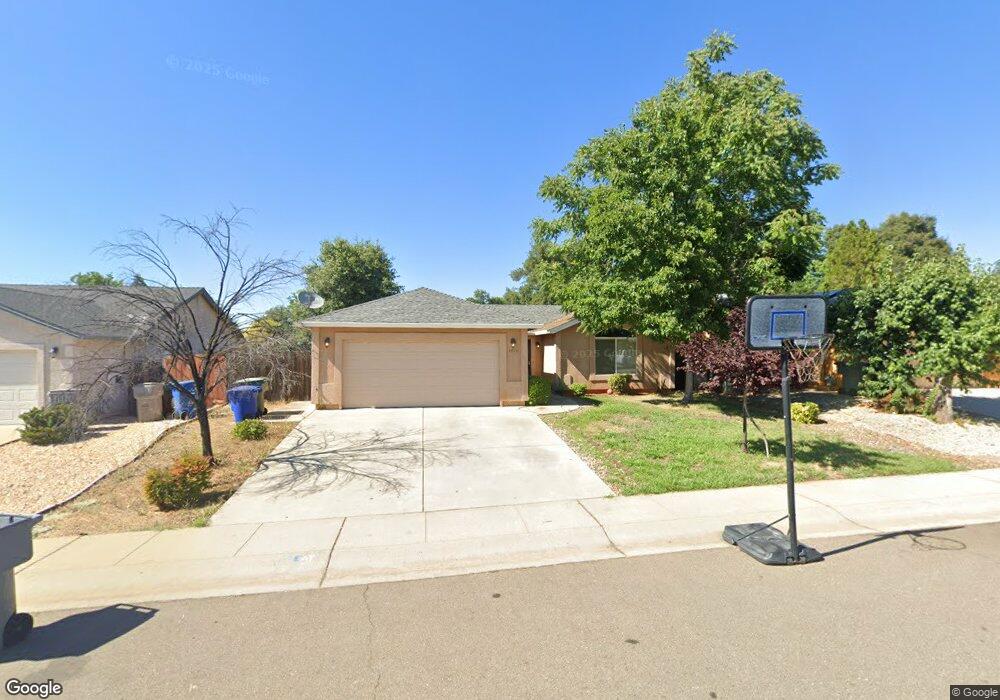
1050 Monterra Ln Redding, CA 96002
Enterprise NeighborhoodEstimated Value: $327,745 - $392,000
3
Beds
2
Baths
1,388
Sq Ft
$257/Sq Ft
Est. Value
About This Home
This home is located at 1050 Monterra Ln, Redding, CA 96002 and is currently estimated at $356,686, approximately $256 per square foot. 1050 Monterra Ln is a home located in Shasta County with nearby schools including Lassen View Elementary School, Parsons Junior High School, and Enterprise High School.
Ownership History
Date
Name
Owned For
Owner Type
Purchase Details
Closed on
Jul 13, 2007
Sold by
Ho David G and Feng Si Xin
Bought by
Ho David G
Current Estimated Value
Home Financials for this Owner
Home Financials are based on the most recent Mortgage that was taken out on this home.
Original Mortgage
$208,000
Outstanding Balance
$125,732
Interest Rate
6.51%
Mortgage Type
New Conventional
Estimated Equity
$230,954
Purchase Details
Closed on
Jul 15, 2005
Sold by
Red Rock Investments
Bought by
Ho David G and Feng Si Xin
Home Financials for this Owner
Home Financials are based on the most recent Mortgage that was taken out on this home.
Original Mortgage
$208,000
Interest Rate
5.56%
Mortgage Type
Fannie Mae Freddie Mac
Create a Home Valuation Report for This Property
The Home Valuation Report is an in-depth analysis detailing your home's value as well as a comparison with similar homes in the area
Home Values in the Area
Average Home Value in this Area
Purchase History
We collect this data history from publicly available records. To have your information removed, we recommend requesting removal directly through your county’s website.
| Date | Buyer | Sale Price | Title Company |
|---|---|---|---|
| Ho David G | -- | None Available | |
| Ho David G | $260,000 | First American Title Co |
Source: Public Records
Mortgage History
We collect this data history from publicly available records. To have your information removed, we recommend requesting removal directly through your county’s website.
| Date | Status | Borrower | Loan Amount |
|---|---|---|---|
| Open | Ho David G | $208,000 | |
| Closed | Ho David G | $208,000 |
Source: Public Records
Tax History
| Year | Tax Paid | Tax Assessment Tax Assessment Total Assessment is a certain percentage of the fair market value that is determined by local assessors to be the total taxable value of land and additions on the property. | Land | Improvement |
|---|---|---|---|---|
| 2025 | $4,043 | $348,326 | $120,572 | $227,754 |
| 2024 | $3,956 | $341,497 | $118,208 | $223,289 |
| 2023 | $3,956 | $334,802 | $115,891 | $218,911 |
| 2022 | $3,826 | $328,238 | $113,619 | $214,619 |
| 2021 | $3,397 | $295,000 | $55,000 | $240,000 |
| 2020 | $3,061 | $265,000 | $50,000 | $215,000 |
| 2019 | $2,811 | $235,000 | $50,000 | $185,000 |
| 2018 | $2,720 | $225,000 | $45,000 | $180,000 |
| 2017 | $2,792 | $215,000 | $45,000 | $170,000 |
| 2016 | $2,523 | $215,000 | $45,000 | $170,000 |
| 2015 | $2,504 | $215,000 | $45,000 | $170,000 |
| 2014 | $2,270 | $196,000 | $40,000 | $156,000 |
Source: Public Records
Map
Nearby Homes
- 1228 Ledell Dr
- 1144 Denton Way
- 4020 Churn Creek Rd
- 1198 Denton Way
- 3759 Alma Ave
- 1513 Harpole Rd
- 4323 Churn Crk Rd
- 1152 Echo Rd
- 751 Woodacre Dr
- 4181 Diane St
- 1397 Empress Ln
- 1613 Galaxy Way
- 1544 Morningsun Dr
- 3708 Traverse St
- 3360 Lawrence Rd
- 3689 Suzanne Way
- 3540 Ricardo Ave
- 3682 Suzanne Way
- 1209 C St
- 1281 Heavenly Oak Ln
- 1056 Monterra Ln
- 1046 Monterra Ln
- Lot 5 Monterra Ln
- 1060 Monterra Ln
- 1040 Monterra Ln
- 1169 de Moll Dr
- 1179 Demol
- 1179 de Moll Dr
- 1159 de Moll Dr
- 1189 de Moll Dr
- 1051 Monterra Ln
- 1057 Monterra Ln
- 1036 Monterra Ln
- 1066 Monterra Ln
- 1066&1068 Monterra
- 1119 de Moll Dr
- 1045 Monterra Ln
- 1063 Monterra Ln
- 1070 Monterra Ln
- 1041 Monterra Ln
Your Personal Tour Guide
Ask me questions while you tour the home.