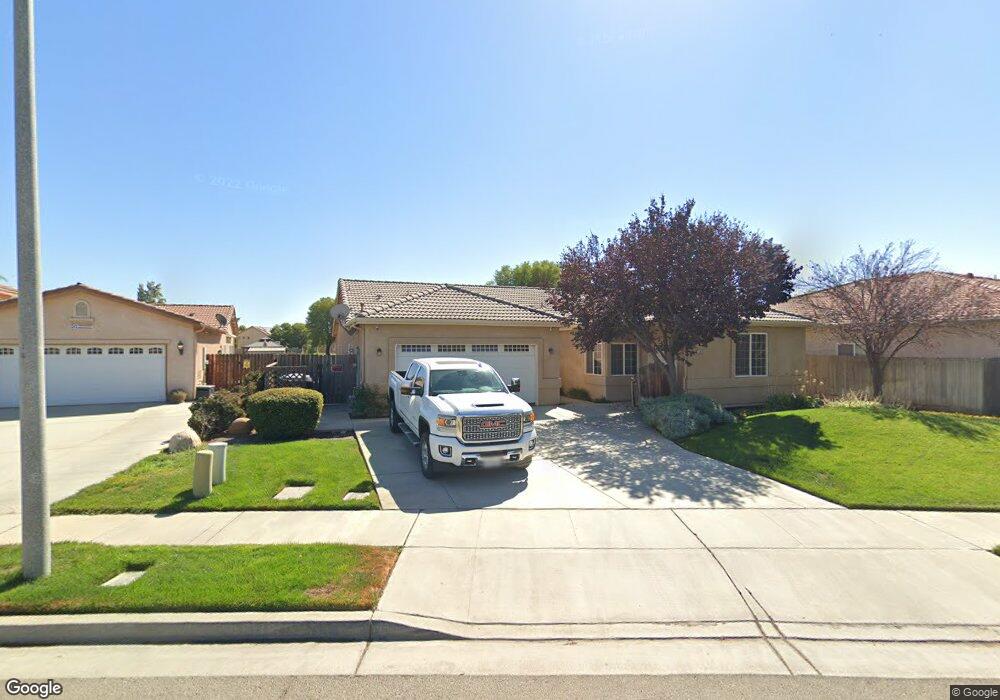
1050 Par Ave Lemoore, CA 93245
Estimated Value: $417,000 - $471,000
3
Beds
2
Baths
2,100
Sq Ft
$212/Sq Ft
Est. Value
About This Home
This home is located at 1050 Par Ave, Lemoore, CA 93245 and is currently estimated at $446,121, approximately $212 per square foot. 1050 Par Ave is a home located in Kings County with nearby schools including P.W. Engvall Elementary School, Liberty Middle School, and Lemoore High School.
Ownership History
Date
Name
Owned For
Owner Type
Purchase Details
Closed on
Sep 12, 2006
Sold by
Fairway Homes
Bought by
Rogers Jones Stephen J and Rogers Jones Hedy E
Current Estimated Value
Home Financials for this Owner
Home Financials are based on the most recent Mortgage that was taken out on this home.
Original Mortgage
$355,148
Outstanding Balance
$206,157
Interest Rate
6.44%
Mortgage Type
Purchase Money Mortgage
Estimated Equity
$239,964
Purchase Details
Closed on
Sep 6, 2005
Sold by
City Of Lemoore
Bought by
Fairway Homes Llc
Create a Home Valuation Report for This Property
The Home Valuation Report is an in-depth analysis detailing your home's value as well as a comparison with similar homes in the area
Home Values in the Area
Average Home Value in this Area
Purchase History
| Date | Buyer | Sale Price | Title Company |
|---|---|---|---|
| Rogers Jones Stephen J | $350,000 | Chicago Title Co | |
| Fairway Homes Llc | -- | -- |
Source: Public Records
Mortgage History
| Date | Status | Borrower | Loan Amount |
|---|---|---|---|
| Open | Rogers Jones Stephen J | $355,148 |
Source: Public Records
Tax History
| Year | Tax Paid | Tax Assessment Tax Assessment Total Assessment is a certain percentage of the fair market value that is determined by local assessors to be the total taxable value of land and additions on the property. | Land | Improvement |
|---|---|---|---|---|
| 2025 | $4,525 | $444,000 | $95,000 | $349,000 |
| 2023 | $4,525 | $473,465 | $154,531 | $318,934 |
| 2022 | $5,304 | $464,182 | $151,501 | $312,681 |
| 2021 | $3,989 | $350,000 | $80,000 | $270,000 |
| 2020 | $3,706 | $324,000 | $75,000 | $249,000 |
| 2019 | $3,470 | $300,000 | $70,000 | $230,000 |
| 2018 | $3,145 | $283,000 | $70,000 | $213,000 |
| 2017 | $3,176 | $280,000 | $70,000 | $210,000 |
| 2016 | $2,897 | $266,700 | $70,000 | $196,700 |
| 2015 | $2,790 | $254,000 | $70,000 | $184,000 |
| 2014 | $2,463 | $226,021 | $60,272 | $165,749 |
Source: Public Records
Map
Nearby Homes
Your Personal Tour Guide
Ask me questions while you tour the home.