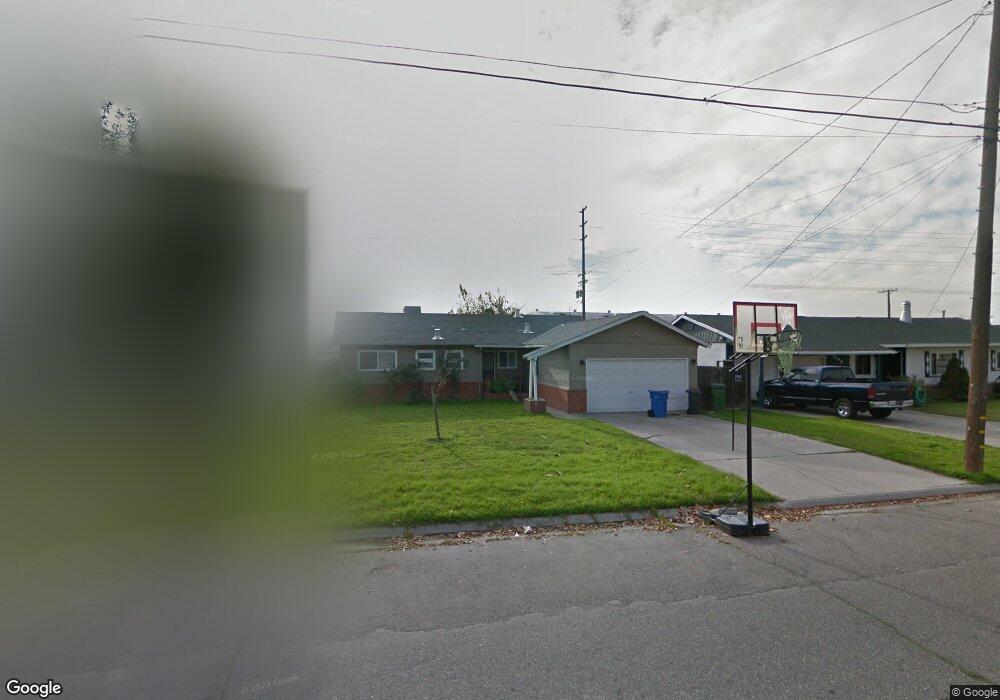
1050 S Minaret Ave Turlock, CA 95380
Estimated Value: $226,000 - $403,000
3
Beds
2
Baths
1,127
Sq Ft
$309/Sq Ft
Est. Value
About This Home
This home is located at 1050 S Minaret Ave, Turlock, CA 95380 and is currently estimated at $348,719, approximately $309 per square foot. 1050 S Minaret Ave is a home located in Stanislaus County with nearby schools including Julien Elementary School, Marvin A. Dutcher Middle School, and Turlock Junior High School.
Ownership History
Date
Name
Owned For
Owner Type
Purchase Details
Closed on
Dec 21, 2017
Sold by
Burgess Owen W and Burgess Teresa M
Bought by
Burgess Owen W and Burgess Teresa M
Current Estimated Value
Purchase Details
Closed on
Jul 25, 2011
Sold by
Milinazzo Barnett Alan D and Milinazzo Barnett Lisa M
Bought by
Burgess Owen W and Burgess Teresa M
Purchase Details
Closed on
Mar 8, 2001
Sold by
Federal National Mortgage Association
Bought by
Milinazzo Barnett Alan D and Milinazzo Barnett Lisa M
Home Financials for this Owner
Home Financials are based on the most recent Mortgage that was taken out on this home.
Original Mortgage
$124,440
Interest Rate
7.11%
Mortgage Type
VA
Purchase Details
Closed on
Sep 19, 2000
Sold by
Jackson Lucy M Tr
Bought by
Federal National Mortgage Association
Create a Home Valuation Report for This Property
The Home Valuation Report is an in-depth analysis detailing your home's value as well as a comparison with similar homes in the area
Home Values in the Area
Average Home Value in this Area
Purchase History
| Date | Buyer | Sale Price | Title Company |
|---|---|---|---|
| Burgess Owen W | -- | None Available | |
| Burgess Owen W | $81,500 | Old Republic Title Company | |
| Milinazzo Barnett Alan D | $122,000 | North American Title Co | |
| Federal National Mortgage Association | $83,426 | Chicago Title |
Source: Public Records
Mortgage History
| Date | Status | Borrower | Loan Amount |
|---|---|---|---|
| Previous Owner | Milinazzo Barnett Alan D | $124,440 |
Source: Public Records
Tax History Compared to Growth
Tax History
| Year | Tax Paid | Tax Assessment Tax Assessment Total Assessment is a certain percentage of the fair market value that is determined by local assessors to be the total taxable value of land and additions on the property. | Land | Improvement |
|---|---|---|---|---|
| 2025 | $1,102 | $102,356 | $37,676 | $64,680 |
| 2024 | $1,081 | $100,350 | $36,938 | $63,412 |
| 2023 | $1,080 | $98,383 | $36,214 | $62,169 |
| 2022 | $1,066 | $96,454 | $35,504 | $60,950 |
| 2021 | $1,050 | $94,563 | $34,808 | $59,755 |
| 2020 | $1,043 | $93,595 | $34,452 | $59,143 |
| 2019 | $1,026 | $91,761 | $33,777 | $57,984 |
| 2018 | $1,025 | $89,963 | $33,115 | $56,848 |
| 2017 | $1,001 | $88,200 | $32,466 | $55,734 |
| 2016 | $935 | $86,472 | $31,830 | $54,642 |
| 2015 | $926 | $85,174 | $31,352 | $53,822 |
| 2014 | $917 | $83,506 | $30,738 | $52,768 |
Source: Public Records
Map
Nearby Homes
- 102 I St
- 228 H St
- 1370 East Ave
- 205 G St
- 1598 East Ave
- 439 Quarto Dr
- 444 Quarto Dr
- 1202 Impression St
- The Cameo Plan at Fifth Edition
- The Aspire Plan at Fifth Edition
- The Palermo Plan at Fifth Edition
- The Mystic Plan at Fifth Edition
- The Dorado Plan at Fifth Edition
- The Sienna Plan at Fifth Edition
- The Haven Plan at Fifth Edition
- 1400 Sycamore St
- 1509 Sycamore St
- 1409 E Marshall St
- 0 E Linwood Ave
- 1438 Cahill Ave
- 1040 S Minaret Ave
- 1060 S Minaret Ave
- 1020 S Minaret Ave
- 1070 S Minaret Ave
- 1051 S Minaret Ave
- 1041 S Minaret Ave
- 1000 S Minaret Ave
- 1061 S Minaret Ave
- 1031 S Minaret Ave
- 1071 S Minaret Ave
- 1021 S Minaret Ave
- 1100 S Minaret Ave
- 980 S Minaret Ave
- 971 S Minaret Ave
- 1030 S Rose St
- 1026 S Rose St
- 960 S Minaret Ave
- 400 Alfreda St
- 1040 S Rose St
- 1112 S Minaret Ave