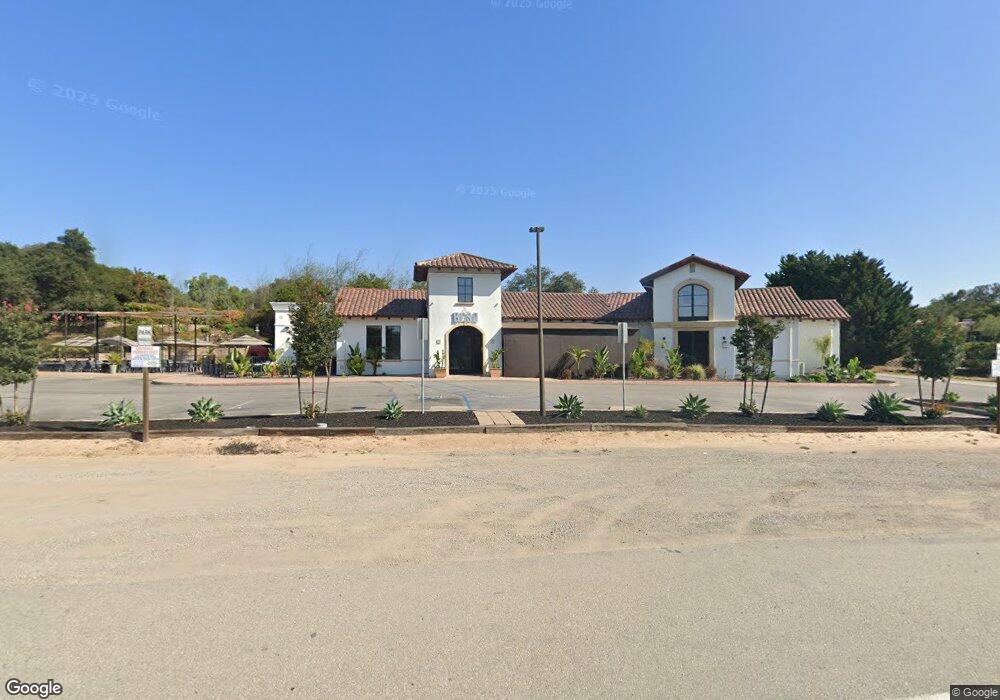
1050 Willow Rd Nipomo, CA 93444
Blacklake NeighborhoodEstimated Value: $1,890,377
--
Bed
--
Bath
--
Sq Ft
1.47
Acres
About This Home
This home is located at 1050 Willow Rd, Nipomo, CA 93444 and is currently estimated at $1,890,377. 1050 Willow Rd is a home located in San Luis Obispo County with nearby schools including Dorothea Lange Elementary School, Mesa Middle School, and Nipomo High School.
Ownership History
Date
Name
Owned For
Owner Type
Purchase Details
Closed on
Mar 16, 2023
Sold by
Smith Livestock Llc
Bought by
Mjs Equipment Llc
Current Estimated Value
Purchase Details
Closed on
Aug 11, 2011
Sold by
Mission Asset Management Inc
Bought by
Smith Vernon E
Home Financials for this Owner
Home Financials are based on the most recent Mortgage that was taken out on this home.
Original Mortgage
$525,000
Interest Rate
4.37%
Mortgage Type
Commercial
Purchase Details
Closed on
Sep 2, 2010
Sold by
Vista Roble Llc
Bought by
Mission Asset Management Inc
Create a Home Valuation Report for This Property
The Home Valuation Report is an in-depth analysis detailing your home's value as well as a comparison with similar homes in the area
Home Values in the Area
Average Home Value in this Area
Purchase History
| Date | Buyer | Sale Price | Title Company |
|---|---|---|---|
| Mjs Equipment Llc | -- | None Listed On Document | |
| Smith Vernon E | -- | First American Title Company | |
| Mission Asset Management Inc | $900,000 | First American Title Co |
Source: Public Records
Mortgage History
| Date | Status | Borrower | Loan Amount |
|---|---|---|---|
| Previous Owner | Smith Vernon E | $525,000 |
Source: Public Records
Tax History Compared to Growth
Tax History
| Year | Tax Paid | Tax Assessment Tax Assessment Total Assessment is a certain percentage of the fair market value that is determined by local assessors to be the total taxable value of land and additions on the property. | Land | Improvement |
|---|---|---|---|---|
| 2025 | $12,453 | $923,186 | $609,178 | $314,008 |
| 2024 | $12,366 | $905,085 | $597,234 | $307,851 |
| 2023 | $12,366 | $887,339 | $585,524 | $301,815 |
| 2022 | $12,258 | $869,942 | $574,044 | $295,898 |
| 2021 | $9,280 | $852,886 | $562,789 | $290,097 |
| 2020 | $9,175 | $844,142 | $557,019 | $287,123 |
| 2019 | $9,119 | $827,592 | $546,098 | $281,494 |
| 2018 | $9,011 | $811,366 | $535,391 | $275,975 |
| 2017 | $8,837 | $795,458 | $524,894 | $270,564 |
| 2016 | $8,337 | $779,861 | $514,602 | $265,259 |
| 2015 | $8,219 | $768,148 | $506,873 | $261,275 |
| 2014 | $7,915 | $753,102 | $496,945 | $256,157 |
Source: Public Records
Map
Nearby Homes
- 1150 Redberry Place
- 940 Calle Fresa
- 639 Barberry Way
- 1337 Black Sage Cir
- 1225 Dawn Rd
- 1276 Pomeroy Rd
- 1060 Dawn Rd
- 1024 Maggie Ln
- 1010 1012 Upper Los Berros Rd
- 1354 Trail View Place
- 620 Camino Roble
- 1084 Emma Ln
- 615 Sweet Donna Place
- 1255 Viva Way
- 462 Camino Perillo
- 1441 Vicki Ln
- 961 Jacqueline Place
- 7855 Suey Creek Rd
- 977 Jacqueline Place
- 875 Camino Caballo