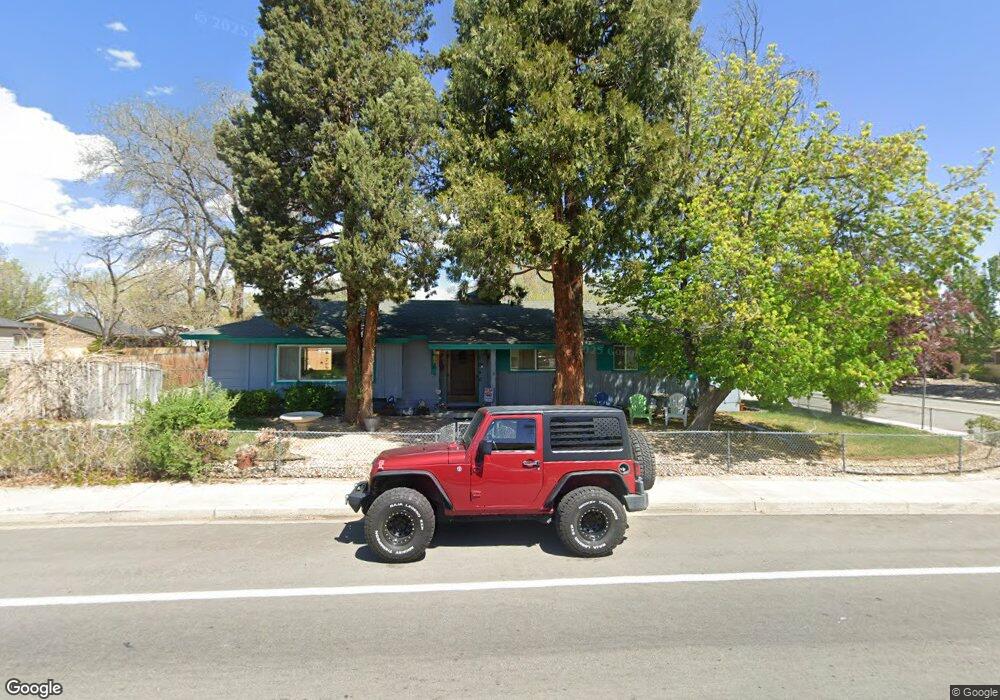
1050 York Way Sparks, NV 89431
North Rock NeighborhoodEstimated Value: $432,499 - $496,000
4
Beds
2
Baths
1,574
Sq Ft
$289/Sq Ft
Est. Value
About This Home
This home is located at 1050 York Way, Sparks, NV 89431 and is currently estimated at $455,125, approximately $289 per square foot. 1050 York Way is a home located in Washoe County with nearby schools including Alice Maxwell Elementary School, Sparks Middle School, and Sparks High School.
Ownership History
Date
Name
Owned For
Owner Type
Purchase Details
Closed on
Oct 25, 2017
Sold by
Mcmikel Sharron L and Hatfield Jesse A
Bought by
Hatfield Laura and Hatfield Jesse
Current Estimated Value
Home Financials for this Owner
Home Financials are based on the most recent Mortgage that was taken out on this home.
Original Mortgage
$117,000
Outstanding Balance
$97,859
Interest Rate
3.78%
Mortgage Type
New Conventional
Estimated Equity
$357,266
Purchase Details
Closed on
May 16, 2013
Sold by
Mcmikel Sharron L
Bought by
Mcmikel Sharron L and Hatfield Jesse A
Purchase Details
Closed on
Jul 15, 2011
Sold by
Engeseth Clara L
Bought by
Mcmikel Sharron L
Home Financials for this Owner
Home Financials are based on the most recent Mortgage that was taken out on this home.
Original Mortgage
$114,034
Interest Rate
4.37%
Mortgage Type
FHA
Purchase Details
Closed on
Oct 30, 1998
Sold by
Engeseth Clara L
Bought by
Engeseth Clara L and The Clara L Engeseth Revocable Trust
Create a Home Valuation Report for This Property
The Home Valuation Report is an in-depth analysis detailing your home's value as well as a comparison with similar homes in the area
Home Values in the Area
Average Home Value in this Area
Purchase History
| Date | Buyer | Sale Price | Title Company |
|---|---|---|---|
| Hatfield Laura | -- | Ticor Title Reno | |
| Mcmikel Sharron L | -- | None Available | |
| Mcmikel Sharron L | $117,000 | First Centennial Reno | |
| Engeseth Clara L | -- | -- |
Source: Public Records
Mortgage History
| Date | Status | Borrower | Loan Amount |
|---|---|---|---|
| Open | Hatfield Laura | $117,000 | |
| Closed | Mcmikel Sharron L | $114,034 |
Source: Public Records
Tax History Compared to Growth
Tax History
| Year | Tax Paid | Tax Assessment Tax Assessment Total Assessment is a certain percentage of the fair market value that is determined by local assessors to be the total taxable value of land and additions on the property. | Land | Improvement |
|---|---|---|---|---|
| 2025 | $926 | $58,757 | $34,825 | $23,932 |
| 2024 | $926 | $53,772 | $30,205 | $23,567 |
| 2023 | $901 | $53,589 | $31,780 | $21,809 |
| 2022 | $875 | $44,931 | $27,160 | $17,771 |
| 2021 | $850 | $35,530 | $18,235 | $17,295 |
| 2020 | $822 | $34,823 | $17,850 | $16,973 |
| 2019 | $800 | $33,703 | $17,605 | $16,098 |
| 2018 | $774 | $27,798 | $12,355 | $15,443 |
| 2017 | $751 | $26,394 | $11,235 | $15,159 |
| 2016 | $734 | $24,991 | $9,765 | $15,226 |
| 2015 | $732 | $23,663 | $8,645 | $15,018 |
| 2014 | $696 | $20,159 | $6,335 | $13,824 |
| 2013 | -- | $18,271 | $4,900 | $13,371 |
Source: Public Records
Map
Nearby Homes
- 1110 Xman Way
- 1160 York Way
- 1125 Dodson Way
- 1345 Plymouth Way
- 1003 Sbragia Way
- 1124 Sbragia Way
- 1705 9th St
- 2154 Oppio St
- 0 N Mccarran Blvd Unit 250052909
- 1595 York Way
- 1121 Greenbrae Dr
- 3269 Valley Forge Way
- 3252 Holman Way
- 1655 Byrd Dr
- 1365 Prospect Ave
- 1945 4th St Unit 32
- 1945 4th St Unit 33
- 1945 4th St Unit 10
- 780 Emerson Way
- 465 Lenwood Dr