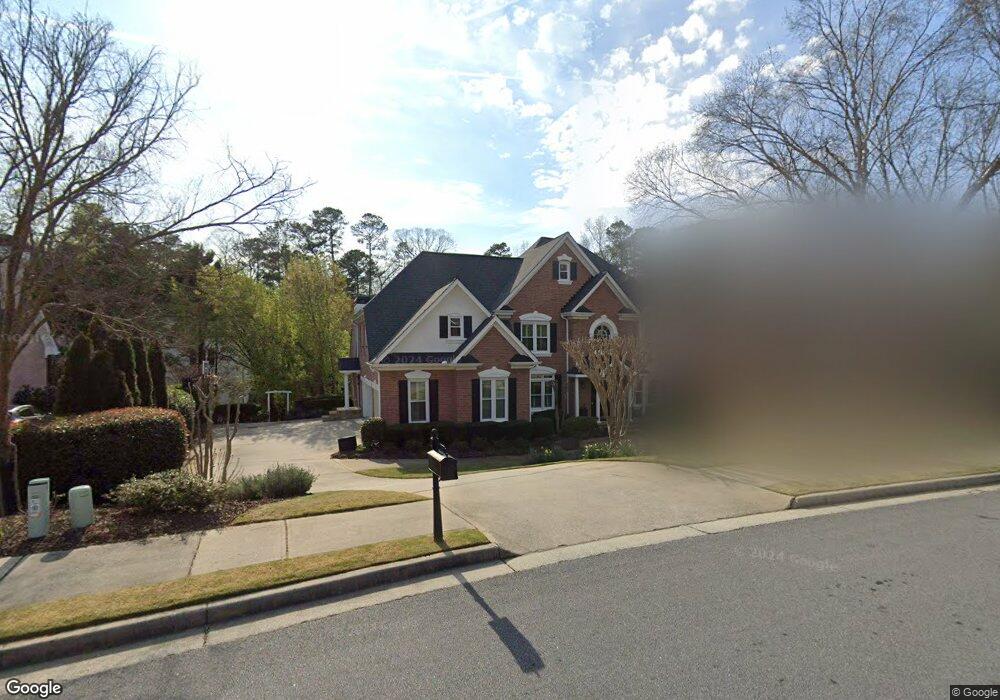
10500 Stanyan St Unit 2 Alpharetta, GA 30022
Estimated Value: $817,000 - $1,247,000
5
Beds
5
Baths
3,939
Sq Ft
$269/Sq Ft
Est. Value
About This Home
This home is located at 10500 Stanyan St Unit 2, Alpharetta, GA 30022 and is currently estimated at $1,058,972, approximately $268 per square foot. 10500 Stanyan St Unit 2 is a home located in Fulton County with nearby schools including Northwood Elementary School, Haynes Bridge Middle School, and Centennial High School.
Ownership History
Date
Name
Owned For
Owner Type
Purchase Details
Closed on
Nov 18, 2024
Sold by
Trute Matthew A
Bought by
Jenkins Janelle Maree Trust and Matthew Trute
Current Estimated Value
Purchase Details
Closed on
Nov 4, 2013
Sold by
Decouto John A
Bought by
Trute Matthew A and Jenkins Janelle M
Home Financials for this Owner
Home Financials are based on the most recent Mortgage that was taken out on this home.
Original Mortgage
$394,500
Interest Rate
3.32%
Mortgage Type
New Conventional
Purchase Details
Closed on
Aug 15, 1997
Sold by
Osley Bldrs Inc
Bought by
Decouto John A and Decouto Sheree
Home Financials for this Owner
Home Financials are based on the most recent Mortgage that was taken out on this home.
Original Mortgage
$214,600
Interest Rate
6.75%
Mortgage Type
New Conventional
Create a Home Valuation Report for This Property
The Home Valuation Report is an in-depth analysis detailing your home's value as well as a comparison with similar homes in the area
Home Values in the Area
Average Home Value in this Area
Purchase History
| Date | Buyer | Sale Price | Title Company |
|---|---|---|---|
| Jenkins Janelle Maree Trust | -- | -- | |
| Trute Matthew A | $577,500 | -- | |
| Decouto John A | $410,300 | -- |
Source: Public Records
Mortgage History
| Date | Status | Borrower | Loan Amount |
|---|---|---|---|
| Previous Owner | Trute Matthew A | $394,500 | |
| Previous Owner | Decouto John A | $214,600 |
Source: Public Records
Tax History Compared to Growth
Tax History
| Year | Tax Paid | Tax Assessment Tax Assessment Total Assessment is a certain percentage of the fair market value that is determined by local assessors to be the total taxable value of land and additions on the property. | Land | Improvement |
|---|---|---|---|---|
| 2025 | $1,138 | $348,480 | $55,440 | $293,040 |
| 2023 | $8,225 | $291,400 | $80,320 | $211,080 |
| 2022 | $5,140 | $285,520 | $41,800 | $243,720 |
| 2021 | $6,095 | $248,600 | $31,920 | $216,680 |
| 2020 | $6,128 | $239,840 | $34,960 | $204,880 |
| 2019 | $943 | $213,400 | $30,080 | $183,320 |
| 2018 | $5,348 | $208,400 | $29,360 | $179,040 |
| 2017 | $5,085 | $186,560 | $22,640 | $163,920 |
| 2016 | $5,059 | $186,560 | $22,640 | $163,920 |
| 2015 | $5,950 | $186,560 | $22,640 | $163,920 |
| 2014 | $5,132 | $180,160 | $16,920 | $163,240 |
Source: Public Records
Map
Nearby Homes
- 530 Kearny St
- 10530 Haynes Forest Dr
- 225 Wentworth Terrace
- 3195 Waters Mill Dr
- 10421 Park Walk Point
- 3273 Long Indian Creek Ct
- 10280 Crescent Ridge Dr
- 3077 Haynes Trail
- 105 May Glen Way
- 385 Birch Rill Dr
- 3040 Roxburgh Dr
- 305 Birch Rill Dr
- 130 Forrest View Terrace
- 10085 Old Woodland Entry
- 3430 Waters Mill Dr
- 3396 Carverton Ln
- 201 Downing Dr Unit 76
- 10490 Stanyan St
- 10510 Stanyan St
- 575 Kearny St
- 580 Kearny St
- 10525 Stanyan St
- 10515 Stanyan St
- 565 Kearny St
- 565 Kearny St Unit 1
- 10520 Stanyan St
- 300 Stanyan Place
- 570 Kearny St Unit 1
- 10470 Stanyan St
- 10470 Stanyan St
- 340 Stanyan Place
- 10530 Stanyan St
- 560 Kearny St
- 555 Kearny St
- 310 Stanyan Place Unit 2
- 10535 Stanyan St
- 330 Stanyan Place