10502 34th Ave Flushing, NY 11368
Corona NeighborhoodEstimated Value: $1,110,107
Studio
--
Bath
2,310
Sq Ft
$481/Sq Ft
Est. Value
About This Home
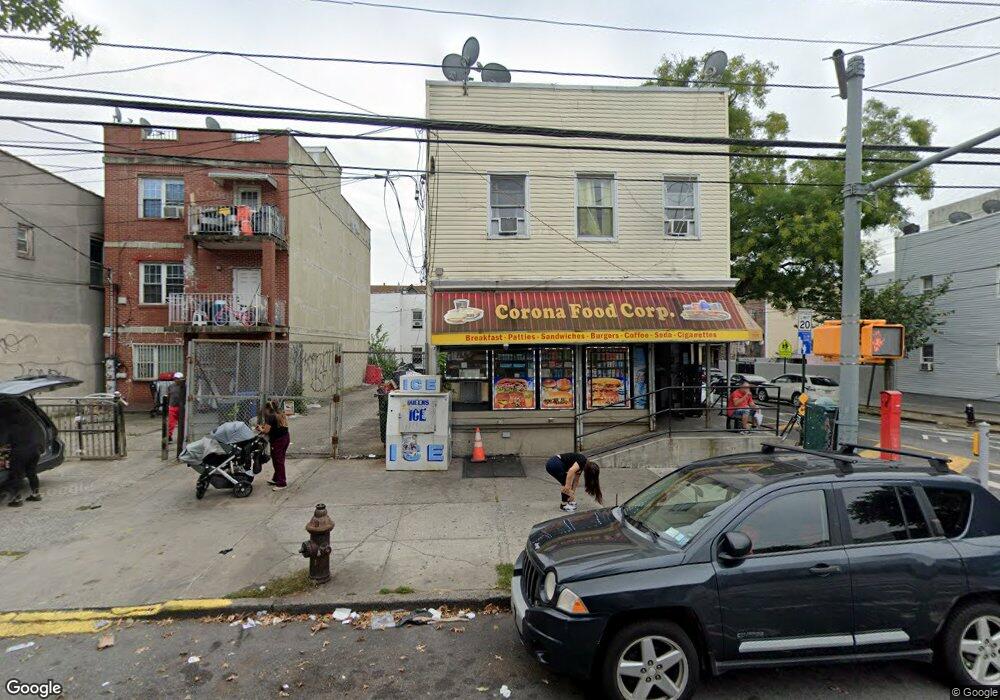
This home is located at 10502 34th Ave, Flushing, NY 11368 and is currently estimated at $1,110,107, approximately $480 per square foot. 10502 34th Ave is a home located in Queens County with nearby schools including P.S. 143 Louis Armstrong, Corona Arts And Sciences Academy, and Newtown High School.
Ownership History
Date
Name
Owned For
Owner Type
Purchase Details
Closed on
Apr 6, 2021
Sold by
Chan Family Property 5835 Llc
Bought by
34 Ave Corona Realty Llc
Current Estimated Value
Home Financials for this Owner
Home Financials are based on the most recent Mortgage that was taken out on this home.
Original Mortgage
$750,000
Outstanding Balance
$674,778
Interest Rate
3.05%
Mortgage Type
Purchase Money Mortgage
Estimated Equity
$435,329
Purchase Details
Closed on
May 6, 2016
Sold by
Paulino Nilsa and Rodriguez Miguel
Bought by
Chan Family Property 5835 Llc
Purchase Details
Closed on
Apr 28, 2003
Sold by
Peralta Arsenio and Peralta Fermin
Bought by
Paulino Nilsa and Rodriguez Miguel
Purchase Details
Closed on
Jan 25, 1999
Sold by
Delacruz Jose
Bought by
Peralta Arsenio and Peralta Fermin
Home Financials for this Owner
Home Financials are based on the most recent Mortgage that was taken out on this home.
Original Mortgage
$217,987
Interest Rate
6.74%
Mortgage Type
FHA
Create a Home Valuation Report for This Property
The Home Valuation Report is an in-depth analysis detailing your home's value as well as a comparison with similar homes in the area
Home Values in the Area
Average Home Value in this Area
Purchase History
| Date | Buyer | Sale Price | Title Company |
|---|---|---|---|
| 34 Ave Corona Realty Llc | $985,000 | -- | |
| 34 Ave Corona Realty Llc | $985,000 | -- | |
| 34 Ave Corona Realty Llc | $985,000 | -- | |
| Chan Family Property 5835 Llc | $980,000 | -- | |
| Chan Family Property 5835 Llc | $980,000 | -- | |
| Chan Family Property 5835 Llc | $980,000 | -- | |
| Paulino Nilsa | $533,000 | -- | |
| Paulino Nilsa | $533,000 | -- | |
| Peralta Arsenio | $245,500 | -- | |
| Peralta Arsenio | $245,500 | -- |
Source: Public Records
Mortgage History
| Date | Status | Borrower | Loan Amount |
|---|---|---|---|
| Open | 34 Ave Corona Realty Llc | $750,000 | |
| Closed | 34 Ave Corona Realty Llc | $750,000 | |
| Previous Owner | Peralta Arsenio | $217,987 | |
| Closed | Paulino Nilsa | $0 |
Source: Public Records
Tax History
| Year | Tax Paid | Tax Assessment Tax Assessment Total Assessment is a certain percentage of the fair market value that is determined by local assessors to be the total taxable value of land and additions on the property. | Land | Improvement |
|---|---|---|---|---|
| 2025 | $7,652 | $40,384 | $8,825 | $31,559 |
| 2024 | $7,652 | $38,098 | $8,843 | $29,255 |
| 2023 | $7,219 | $35,942 | $7,610 | $28,332 |
| 2022 | $6,745 | $53,880 | $13,440 | $40,440 |
| 2021 | $7,382 | $52,260 | $13,440 | $38,820 |
| 2020 | $7,123 | $62,940 | $13,440 | $49,500 |
| 2019 | $6,641 | $66,240 | $13,440 | $52,800 |
| 2018 | $6,106 | $29,952 | $7,293 | $22,659 |
| 2017 | $6,062 | $29,736 | $7,718 | $22,018 |
| 2016 | $5,844 | $29,736 | $7,718 | $22,018 |
| 2015 | $3,383 | $28,044 | $10,487 | $17,557 |
| 2014 | $3,383 | $26,457 | $11,876 | $14,581 |
Source: Public Records
Map
Nearby Homes
- 10519 34th Ave
- 3416 107th St
- 3417 103rd St Unit 103+P6
- 34-46 107th St
- 3416 103rd St
- 35-38 104th St
- 35-18 108th St
- 34-11 102nd St
- 35-44 104th St
- 108-14 35th Ave
- 108-10 34th Ave
- 106-07 Northern Blvd Unit 5B
- 3260 106th St Unit 2C
- 108-10 35th Ave
- 10817 35th Ave
- 33-34 109th St
- 104-37 37th Rd
- 32-45 105th St
- 37-13 104th St
- 10716 37th Ave Unit 3B
Your Personal Tour Guide
Ask me questions while you tour the home.