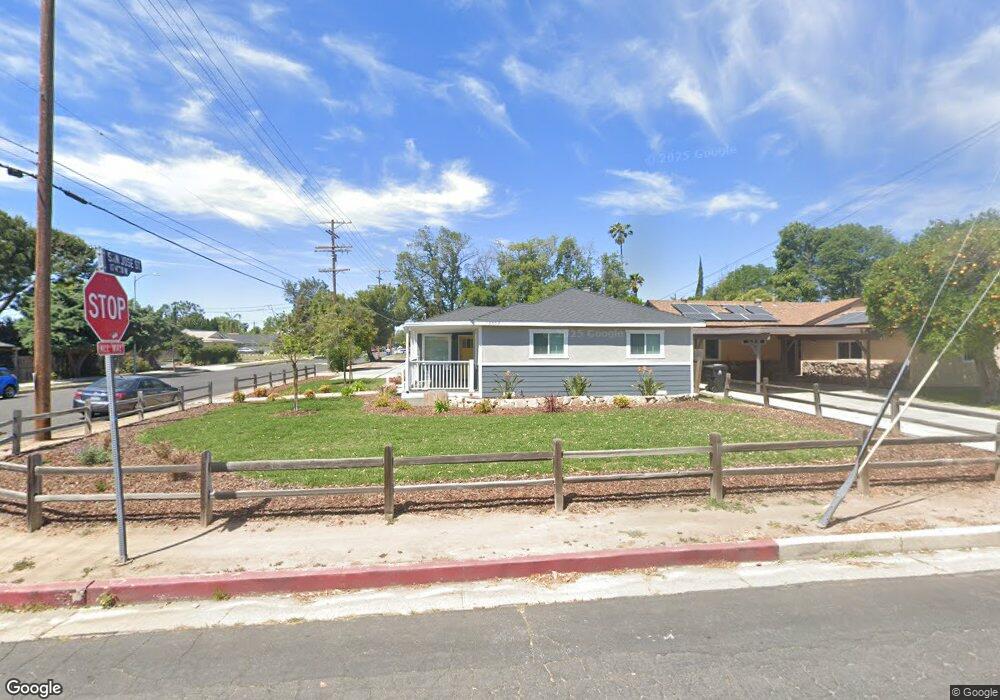
10503 Andasol Ave Granada Hills, CA 91344
Estimated Value: $875,850 - $939,000
3
Beds
2
Baths
1,418
Sq Ft
$646/Sq Ft
Est. Value
About This Home
This home is located at 10503 Andasol Ave, Granada Hills, CA 91344 and is currently estimated at $916,713, approximately $646 per square foot. 10503 Andasol Ave is a home located in Los Angeles County with nearby schools including Granada Elementary School for Advanced Studies, Patrick Henry Middle School, and Valley Academy of Arts & Sciences.
Ownership History
Date
Name
Owned For
Owner Type
Purchase Details
Closed on
Mar 14, 2001
Sold by
Lopez Ignacio
Bought by
Lopez Ian A
Current Estimated Value
Home Financials for this Owner
Home Financials are based on the most recent Mortgage that was taken out on this home.
Original Mortgage
$157,500
Outstanding Balance
$57,522
Interest Rate
7.06%
Estimated Equity
$859,191
Purchase Details
Closed on
May 28, 1998
Sold by
Brown Elizabeth M
Bought by
Salinas J Scott
Home Financials for this Owner
Home Financials are based on the most recent Mortgage that was taken out on this home.
Original Mortgage
$153,800
Interest Rate
7.03%
Purchase Details
Closed on
Jul 25, 1997
Sold by
Brown Robert J
Bought by
Brown Robert J and Robert J Brown Revocable Living Trust
Purchase Details
Closed on
Jul 22, 1997
Sold by
Brown Robert J
Bought by
Brown Robert J and Brown Elizabeth M
Create a Home Valuation Report for This Property
The Home Valuation Report is an in-depth analysis detailing your home's value as well as a comparison with similar homes in the area
Home Values in the Area
Average Home Value in this Area
Purchase History
| Date | Buyer | Sale Price | Title Company |
|---|---|---|---|
| Lopez Ian A | -- | Fidelity National Title Co | |
| Salinas J Scott | $171,000 | First American Title Co | |
| Brown Robert J | -- | -- | |
| Brown Robert J | -- | -- |
Source: Public Records
Mortgage History
| Date | Status | Borrower | Loan Amount |
|---|---|---|---|
| Open | Lopez Ian A | $157,500 | |
| Closed | Salinas J Scott | $153,800 |
Source: Public Records
Tax History Compared to Growth
Tax History
| Year | Tax Paid | Tax Assessment Tax Assessment Total Assessment is a certain percentage of the fair market value that is determined by local assessors to be the total taxable value of land and additions on the property. | Land | Improvement |
|---|---|---|---|---|
| 2025 | $3,567 | $277,478 | $176,983 | $100,495 |
| 2024 | $3,567 | $272,038 | $173,513 | $98,525 |
| 2023 | $3,502 | $266,705 | $170,111 | $96,594 |
| 2022 | $3,347 | $261,476 | $166,776 | $94,700 |
| 2021 | $3,301 | $256,350 | $163,506 | $92,844 |
| 2019 | $3,107 | $240,298 | $158,657 | $81,641 |
| 2018 | $2,981 | $235,588 | $155,547 | $80,041 |
| 2016 | $2,838 | $226,442 | $149,508 | $76,934 |
| 2015 | $2,798 | $223,042 | $147,263 | $75,779 |
| 2014 | $2,814 | $218,674 | $144,379 | $74,295 |
Source: Public Records
Map
Nearby Homes
- 17520 Kingsbury St
- 17559 Devonshire St
- 17222 Kingsbury St
- 17623 Clymer St
- 10415 Wish Ave
- 17230 Chatsworth St Unit 1
- 17531 Romar St
- 17317 Los Alimos St
- 17175 Chatsworth St
- 10224 Zelzah Ave Unit 4
- 17641 Los Alimos St
- 17813 Lemarsh St
- 10111 Oak Park Ave
- 17727 Merridy St Unit 18
- 10452 Balboa Blvd
- 9930 Aldea Ave
- 17257 Horace St
- 17171 Septo St
- 10501 Forbes Ave
- 16940 Chatsworth St Unit 208
- 10507 Andasol Ave
- 10499 Andasol Ave
- 10513 Andasol Ave
- 10455 Andasol Ave
- 10517 Andasol Ave
- 10449 Andasol Ave
- 17351 San Jose St
- 10506 Andasol Ave
- 10523 Andasol Ave
- 17427 San Jose St
- 10512 Andasol Ave
- 17424 San Jose St
- 10518 Andasol Ave
- 10443 Andasol Ave
- 10527 Andasol Ave
- 17433 San Jose St
- 17421 San Jose St
- 17432 San Jose St
- 10522 Andasol Ave
- 17425 San Jose St